ANALYSE COÛT/RETOUR SUR INVESTISSEMENT
Coût total de possession : Analyse du CTP ISBM sur 10 ans pour les embouteilleurs coréens
Le coût d'investissement initial ne représente que 20 à 301 TP3T du coût total de possession sur 10 ans d'une machine ISBM. Les coûts d'exploitation, de maintenance, les temps d'arrêt et l'obsolescence constituent la majeure partie du coût total sur la durée de vie. Ce guide présente un modèle complet de coût total de possession comparant la plateforme coréenne Ever-Power aux plateformes japonaises existantes pour toutes les catégories de coûts, démontrant ainsi l'origine de l'avantage de coût global de 40 à 551 TP3T.
Dans ce guide
- Pourquoi le coût total de possession (TCO) est plus important que le coût d'investissement
- Sept catégories de coûts du TCO
- Ventilation des dépenses d'exploitation annuelles
- Maintenance tout au long du cycle de vie
- Coût des temps d'arrêt et des pertes de production
- Catégories de coûts cachés souvent négligées
- Coût total de possession (TCO) sur 10 ans : comparaison entre la Corée et le Japon
- Stratégies d'optimisation du coût total de possession
- Étude de cas complète sur le coût total de possession (TCO)
- Conclusion
1. Pourquoi le coût total de possession (TCO) est plus important que le coût d'investissement
Usine d'embouteillage ISBM coréenne : le coût d'investissement ne représente que 20 à 301 TP3 T du coût total de possession sur 10 ans ; les coûts d'exploitation et les temps d'arrêt sont prédominants.
Les décisions d'achat fondées uniquement sur le coût d'acquisition aboutissent régulièrement à des coûts 30 à 50 % plus élevés sur une durée de vie de 10 ans que l'option apparemment moins chère. Le coût total de possession (CTP) est le cadre de comparaison des différentes options d'investissement sur l'ensemble du cycle de vie, incluant l'acquisition du capital, les frais d'exploitation, les besoins de maintenance, l'impact des arrêts de production et la valeur de revente ou de mise au rebut en fin de vie. Pour une machine ISBM d'une durée de vie utile de 10 à 15 ans, l'analyse du CTP révèle les éléments économiques qui justifient ou non l'achat de chaque option.
Les embouteilleurs coréens qui comparent les plateformes Ever-Power aux plateformes japonaises ASB ou Aoki existantes constatent un profil de coût total de possession (CTP) spécifique : le coût d’investissement des plateformes japonaises est supérieur de 60 à 1 000 TP3 T à celui des plateformes Ever-Power (prix d’achat direct des machines), tandis que leurs coûts d’exploitation sont supérieurs de 18 à 350 TP3 T à ceux des plateformes Ever-Power, en raison d’une consommation d’énergie plus élevée, d’un débit horaire inférieur et de la dépendance aux pièces détachées importées. Ces deux facteurs se cumulent sur une période de 10 ans, ce qui se traduit par un avantage de 40 à 550 TP3 T en termes de CTP pour les plateformes Ever-Power coréennes dans des scénarios de production typiques.
L'approche du coût total de possession (CTP) remplit trois fonctions décisionnelles qui vont au-delà d'une simple comparaison des coûts. Premièrement, elle met en lumière des catégories de coûts cachés souvent négligées lors des processus d'approbation budgétaire (inflation des pièces détachées, coûts de traduction de la documentation japonaise, coûts de formation pour les utilisateurs non natifs). Deuxièmement, elle permet une comparaison directe entre différentes options présentant des profils de coûts d'investissement et d'exploitation distincts. Troisièmement, elle quantifie l'impact financier des événements du cycle de vie (révision majeure à 5 ans, obsolescence du système de contrôle à 8 ans, revente ou remplacement en fin de vie à 12 ans), impact que le simple calcul du délai de récupération ne permet pas d'appréhender. Pour une méthodologie de base de calcul du retour sur investissement (RSI), veuillez consulter le guide associé avant d'effectuer une analyse du CTP.
2. Sept catégories de coûts du TCO
Un modèle de coût total de possession (CTP) complet prend en compte sept catégories de coûts distinctes tout au long du cycle de vie du produit. Chaque catégorie présente des caractéristiques d'ampleur, de calendrier et de prévisibilité différentes qui nécessitent une analyse spécifique.
1. Coût d'acquisition du capital
Machine principale, équipements auxiliaires, outillage de moulage, installation, formation. Ces dépenses sont principalement engagées l'année 0, avec un faible renouvellement des moules entre les années 4 et 6. Il s'agit du poste de dépense le plus important, mais sa part dans le coût total du cycle de vie est plus faible qu'il n'y paraît.
2. Résine et consommables
Résine PET, composants de mélanges rPET, produits chimiques de nettoyage, médias filtrants, fournitures d'emballage. Catégorie la plus importante depuis plus de 10 ans. Variation selon la machine : efficacité énergétique, potentiel d'optimisation de l'épaisseur des parois et taux de rebut.
3. Coût de la main-d'œuvre
Salaires des opérateurs, temps de supervision, techniciens de contrôle qualité. Le salaire minimum coréen et l'inflation du travail (3 à 51 000 000 KRW par an) s'accumulent sur 10 ans. Les machines entièrement servo-commandées permettent de réduire le nombre de postes par équipe grâce à l'automatisation par automate programmable, ce qui représente une économie d'environ 150 à 200 millions de KRW par an.
4. Électricité et services publics
KEPCO fournit de l'électricité industrielle (110-140 KRW/kWh), de l'eau glacée, de l'air comprimé et de l'eau d'appoint pour les tours de refroidissement. Les machines entièrement servo-motorisées permettent une réduction de la consommation électrique de 15 à 251 TP3T par rapport à un système hydraulique équivalent. L'inflation des tarifs d'électricité en Corée est en moyenne de 2,5 à 41 TP3T par an.
5. Maintenance et pièces détachées
Maintenance programmée, remplacement des pièces d'usure, réapprovisionnement des kits de pièces détachées, frais de contrat de service. Ces coûts augmentent progressivement au fil de la durée de vie de la machine : de 2 à 31 000 milliards de dollars d'investissement les 3 premières années, et de 4 à 61 000 milliards de dollars les 7 à 10 dernières années. Le service après-vente des machines Ever-Power, fabriquées en Corée, est nettement moins dépendant des pièces importées du Japon.
6. Coût des temps d'arrêt de production
Perte de marge sur coûts variables lors d'arrêts imprévus et de maintenances planifiées. Ligne de production de boissons coréennes : exposition de 8 à 15 millions de KRW/heure. La fiabilité de la plateforme et la disponibilité des pièces détachées ont un impact direct sur cette catégorie. Il s'agit souvent du principal coût caché qui distingue les plateformes coréennes (fabrication locale) des plateformes japonaises (importation).
7. Valeur de revente/de récupération en fin de vie
Valeur de revente sur le marché secondaire ou valeur de recyclage des métaux à 10 ou 15 ans. Les machines Ever-Power bien entretenues conservent généralement entre 12 et 181 000 tonnes de capital initial à 10 ans. Les plateformes japonaises existantes conservent entre 8 et 141 000 tonnes en raison de l'obsolescence de leurs systèmes de contrôle. Cette valeur récupérée compense une partie du coût d'investissement initial dans le calcul du coût total de possession (CTP).
3. Ventilation des charges d'exploitation annuelles
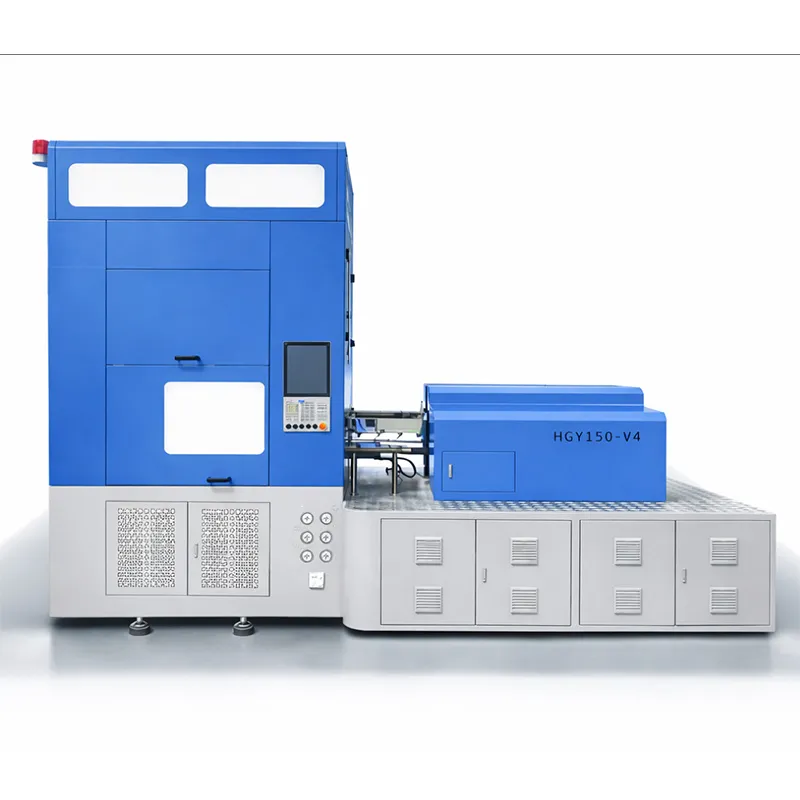
Plateforme HGY150-V4 — coût d'exploitation annuel représentatif d'environ 1 170 millions de KRW pour un volume de production de 25 millions de bouteilles.
Calcul annuel des dépenses d'exploitation pour une machine HGY150-V4 représentative avec une production annuelle de 25 millions de bouteilles (format eau 500 ml, moule à 6 cavités, TRS 82%) :
| Ligne OPEX | Calcul | Annuel (M KRW) |
|---|---|---|
| résine PET | 12 g × 25 m × 1 550 KRW/kg | 465 |
| Main-d'œuvre (3 équipes, 2 opérateurs chacune) | 6 opérateurs × 4,8 M/mois × 12 | 346 |
| Électricité | 36 kW × 8 760 h × 80% × 125 KRW | 31.5 |
| Air comprimé (compresseur dédié) | coût de fonctionnement d'un compresseur de 25 CV | 48 |
| Eau glacée / refroidissement | Refroidisseur + tour + alimentation en eau | 28 |
| Maintenance et pièces détachées | 2,51 TP3T de capital des années 1 à 3, en hausse | 32 |
| Consommables (filtres, lubrifiant, produits de nettoyage) | Approvisionnement continu en consommables | 15 |
| Coût des temps d'arrêt (31 heures productives TP3T) | Imprévu + planifié, perte de marge | 185 |
| DÉPENSES D'EXPLOITATION ANNUELLES TOTALES | — | 1,150 |
Sur une période de 10 ans, avec une inflation annuelle de 31 000 milliards de wons pour la main-d'œuvre et de 2 510 milliards de wons pour l'électricité, les dépenses d'exploitation totales (OPEX) sur 10 ans avoisinent 12,8 milliards de wons coréens (KRW). Les coûts d'investissement, d'un montant de 1,2 milliard de wons coréens, ne représentent que 8 610 milliards de wons coréens (KRW) des dépenses cumulées sur 10 ans. Les OPEX constituent de loin le principal poste de dépenses du coût total de possession (TCO).
4. Maintenance tout au long du cycle de vie
Les coûts de maintenance suivent une courbe en baignoire prévisible tout au long de la durée de vie de la machine. Les premières années (1 à 3) sont peu coûteuses, car les pièces d'usure sont neuves. Les années intermédiaires (4 à 7) connaissent des coûts de maintenance stables. Enfin, les dernières années (8 à 10 et plus) sont marquées par une augmentation des coûts due à l'usure cumulative et à l'approche de la fin de vie des composants du système de contrôle.
Évolution typique des coûts de maintenance :
- ✓Année 1 : 1,5 à 2,01 TP3T du coût du capital ; la couverture de garantie prend en charge la plupart des événements imprévus
- ✓Année 2-3 : 2,5 à 3,01 TP3T du coût d'investissement ; premiers composants d'usure atteignant le calendrier de remplacement
- ✓Année 4-5 : 3.5-4.5% incluant la première révision majeure (cycles 2,5 à 3M) ; remplacement des joints hydrauliques, alignement du plateau
- ✓Années 6 à 8 : 4.5-6.0% ; remise à neuf du servomoteur, remplacement de la vis/du cylindre d’injection, vieillissement des composants du système de commande
- ✓Année 9-10+ : 6.0-8.0% ; deuxième révision majeure, mise à niveau du système de contrôle ou point de décision de fin de vie
Coût des pièces détachées importées par rapport aux pièces détachées nationales
Les pièces détachées pour plateformes japonaises coûtent généralement 2,2 à 3,5 fois plus cher que leurs équivalents Ever-Power en Corée, en raison des marges d'importation, des droits de douane et du risque de change. Un kit de joints pour vérin hydraulique japonais à 4,5 millions de wons (KRW), équivalent à un kit coréen à 1,5 million de KRW, engendre un désavantage financier considérable sur 10 ans de dépenses de maintenance régulières.
5. Coût des temps d'arrêt et des pertes de production
Les arrêts de production représentent le poste de coût total de possession (CTP) le plus sous-estimé. Les embouteilleurs coréens fonctionnant 24 h/24 et 7 j/7 perdent entre 8 et 15 millions de wons coréens (KRW) de marge contributive par heure de ligne lors d'un arrêt non planifié. Un temps d'arrêt cumulé de 3 à 51 000 milliards de wons (3 000 à 5 100 000 heures productives) par an correspond à 260 à 430 heures par an, générant un coût cumulé de 2 à 6 milliards de wons coréens (KRW) sur 10 ans.
Les temps d'arrêt non planifiés constituent souvent le principal facteur de différenciation du coût total de possession (TCO) entre les plateformes Ever-Power coréennes et les plateformes japonaises existantes.
Facteurs de coût liés aux temps d'arrêt :
- ▸Délai de livraison des pièces détachées : Un délai de livraison de 2 à 5 jours par le fournisseur entraîne une perte de production directe proportionnelle à la durée d'arrêt.
- ▸Disponibilité des techniciens de maintenance : L'équipe d'ingénierie locale coréenne d'Ever-Power répond sous 24 à 48 heures, contre 3 à 5 jours pour le fournisseur japonais.
- ▸Disponibilité des kits de pièces détachées : Le kit KRW 8-11 M sur site élimine le délai de livraison des pièces de rechange 60-70%
- ▸Clauses pénales pour les clients : Les contrats des marques de boissons coréennes incluent de plus en plus de pénalités d'arrêt de production de 15 à 30 KRW par unité manquante.
- ▸Exigence de stock tampon : Une plus grande variabilité des temps d'arrêt entraîne des coûts de stockage de sécurité plus élevés au niveau des lignes de remplissage en aval.
6. Catégories de coûts cachés souvent négligées
Les modèles standard d'analyse du coût total de possession (CTP) couvrent entre 80 et 85 000 £ (TP3T). Les 15 à 20 000 £ restants se dissimulent dans des catégories généralement négligées lors des processus d'approbation budgétaire. Les embouteilleurs coréens qui réalisent une analyse du CTP a posteriori constatent fréquemment que ces catégories cachées expliquent l'écart entre le coût total de possession projeté et le coût réel.
Documentation et traduction linguistique
La documentation technique des machines, généralement en japonais ou en anglais, nécessite une traduction en coréen pour les opérateurs coréens. La qualité de la traduction des contenus techniques influe sur l'efficacité de la formation et la précision du dépannage. Coût annuel : 5 à 15 millions de wons coréens pour les services de traduction, la mise à jour des manuels techniques et l'élaboration de procédures opérationnelles standard (SOP) à partir de la documentation importée.
Exposition au risque de change
Les fluctuations des taux de change USD/KRW et JPY/KRW influent sur le coût des pièces détachées importées et les frais de maintenance des plateformes japonaises. Une dépréciation du KRW (101 000 milliards de wons) se traduit par une hausse du coût des pièces détachées en monnaie locale (101 000 milliards de wons). Les coûts de couverture représentent généralement entre 1 000 et 21 000 milliards de wons de dépenses d'importation par an afin de gérer le risque de change.
Obsolescence du système de contrôle
La plupart des fournisseurs de composants PLC et IHM atteignent la fin de leur cycle de vie après 7 à 10 ans. Leur maintien en service nécessite l'approvisionnement en pièces détachées provenant d'unités mises au rebut, de marchés spécialisés de reconditionnement, ou une modernisation complète du système de contrôle, pour un coût de 180 à 350 millions de wons coréens. La société coréenne Ever-Power utilise des automates programmables Siemens/Mitsubishi de dernière génération, bénéficiant d'un support technique standard de plus de 15 ans.
Conversion et installation électriques
Les plateformes japonaises sont livrées avec une tension native de 200 V/50 Hz ; l’infrastructure coréenne (380 V/60 Hz) nécessite une conversion du transformateur, engendrant des coûts de 25 à 45 millions de wons coréens et des pertes d’efficacité électrique continues de l’ordre de 1 à 21 TP3T. Ever-Power livre des installations natives en 380 V/60 Hz ; aucune conversion n’est requise. Économies cumulées sur 10 ans : de 15 à 30 millions de wons coréens sur le coût du transformateur et les pertes d’électricité cumulées.
7. Coût total de possession (CTP) sur 10 ans : Corée vs Japon
Une comparaison directe du coût total de possession (TCO) entre la centrale coréenne Ever-Power HGY150-V4 et une plateforme japonaise de référence de niveau ASB-12M révèle où se concentre l'avantage en termes de coûts sur la durée de vie. Tous les chiffres sont exprimés en milliards de wons coréens (KRW) pour une durée de possession de 10 ans d'une plateforme ISBM comparable à 4 stations produisant 25 millions de bouteilles par an. Voir Spécifications du HGY150-V4 pour connaître les prix actuels.
| Catégorie TCO | Toujours-Puissance (B KRW) |
japonais (B KRW) |
coréen Économies |
|---|---|---|---|
| Acquisition de capital (année 0) | 1.24 | 2.15 | 0.91 |
| Résine PET (cumulatif sur 10 ans) | 5.10 | 5.25 | 0.15 |
| Travail (10 ans avec inflation) | 3.05 | 3.60 | 0.55 |
| Électricité et services publics | 0.82 | 1.12 | 0.30 |
| Maintenance et pièces détachées | 0.55 | 1.18 | 0.63 |
| Coût des temps d'arrêt | 1.85 | 3.20 | 1.35 |
| Coûts cachés (traduction, change, obsolescence) | 0.08 | 0.47 | 0.39 |
| Rétablissement en fin de vie (négatif) | (0.18) | (0.22) | (0.04) |
| COÛT TOTAL SUR 10 ANS | 12.51 | 16.75 | 4.24 |
Les économies coréennes de 4,24 milliards de KRW représentent une réduction de 25,31 billions de KRW du coût total de possession (TCO) sur 10 ans, répartie entre les coûts d'investissement (0,91 milliard), la main-d'œuvre (0,55 milliard), les services publics (0,30 milliard), la maintenance (0,63 milliard), les temps d'arrêt (1,35 milliard) et les coûts cachés (0,39 milliard). Les coûts liés aux temps d'arrêt constituent la principale source d'économies, car le réseau de services local coréen réduit considérablement le délai moyen de réparation par rapport à la dépendance aux services importés au Japon.
8. Stratégies d'optimisation du coût total de possession (TCO)
Au-delà du choix de la plateforme, les embouteilleurs coréens peuvent optimiser activement le coût total de possession grâce à six pratiques opérationnelles et d'approvisionnement qui génèrent des économies cumulatives sur la durée de vie.
Pratiques d'optimisation du coût total de possession (TCO) :
- ✓Optimisation de la masse des préformes : La réduction de masse du 3-5% permet d'économiser 140 à 250 millions de KRW par an sur la résine pour un volume de bouteille de 25 millions de litres.
- ✓Spécifications complètes du servo : 15-25% : économies d'électricité et réduction de la main-d'œuvre cumulées, soit un avantage annuel de 50 à 70 millions de KRW.
- ✓Kit de pièces de rechange sur site : Un investissement de 8 à 11 millions de KRW dans un kit permet d'économiser 12 à 24 jours d'arrêt de production par an, soit un coût de 150 à 400 millions de KRW.
- ✓Programme d'entretien préventif : Le remplacement planifié est plus avantageux que le remplacement réactif en termes de facteur de coût 30-50%
- ✓Capacité de mélange avec du rPET : Les dépenses d'investissement liées à la conformité K-EPR sont récupérées en 2 à 3 ans grâce à l'évitement des pénalités pour non-conformité.
- ✓Contrat de service local coréen : Une intervention sous 24 à 48 heures réduit les coûts d'indisponibilité de 60 à 70 % par rapport à une intervention à l'étranger.
9. Étude de cas complète du coût total de possession
Étude de cas d'un embouteilleur coréen : une comparaison du coût total de possession (TCO) sur 10 ans oriente la décision de choix de plateforme stratégique, avec un différentiel de coût sur la durée de vie de plus de 4 milliards de KRW.
Cas : Décision concernant la plateforme d'embouteillage de boissons de Busan
Situation: Une usine coréenne d'embouteillage de boissons à Busan ajoute une troisième ligne ISBM pour accroître sa capacité de production. Elle évalue actuellement la plateforme Ever-Power HGY150-V4 par rapport à la plateforme japonaise équivalente ASB-12M pour la production de bouteilles d'eau de 500 ml à un rythme annuel de 28 millions d'unités.
Contexte décisionnel :
- Budget d'investissement approuvé avec un plafond de 2 milliards de wons coréens
- Engagement de volume de production de la part du client de marque en aval
- L'installation existante dispose de 2 machines japonaises ASB-12M âgées de 8 et 11 ans.
- Le directeur financier a demandé une analyse complète du coût total de possession (TCO) sur 10 ans avant l'autorisation d'achat.
Résultats de l'analyse du coût total de possession (fenêtre de 10 ans) :
- Coût total de possession (TCO) sur 10 ans du groupe électrogène Ever-Power HGY150-V4 : 13,42 milliards de KRW
- Coût total de possession (TCO) sur 10 ans équivalent à celui d'un ASB-12M japonais : 17,95 milliards de KRW
- Économies Ever-Power : 4,53 milliards de KRW (réduction de 25,21 TP3T)
Principaux éléments de différenciation :
- Économies de capital : 920 millions de KRW (Ever-Power 1,19 milliard contre 2,11 milliards pour les constructeurs japonais)
- Économies sur les temps d'arrêt pendant 10 ans : 1,48 milliard de KRW (avantage du service local coréen)
- Économies de main-d'œuvre : 610 millions de KRW (réduction du nombre d'opérateurs pour une servocommande complète)
- Économies sur la maintenance : 690 millions de KRW (avantage lié au coût des pièces détachées locales)
- Économies d'électricité : 340 millions de KRW (réduction complète du servo 15-25%)
- Économies cachées : 450 millions de KRW (pas de transformateur, pas de conversion, pas de risque de change)
Le directeur financier a approuvé le choix de la plateforme Ever-Power suite à une analyse rigoureuse du coût total de possession (TCO) qui a mis en évidence un avantage de coût de 4,53 milliards de KRW sur la durée de vie, invisible lors d'une simple comparaison des coûts d'investissement. L'embouteilleur s'est engagé avec la plateforme Ever-Power, avec un délai de livraison et de mise en service de 18 mois ; la comparaison avec les plateformes japonaises a été abandonnée avant même la demande de devis officielle.
10. Conclusion
L'analyse du coût total de possession (CTP) révèle les aspects économiques du cycle de vie que la simple comparaison des coûts d'investissement ne permet pas d'appréhender. Pour les décisions d'investissement coréennes dans les systèmes ISBM (Integrated Stock Manufacturers and Exchange Board of Korea) impliquant un investissement de 1,2 à 2,5 milliards de KRW sur une durée de vie opérationnelle supérieure à 10 ans, l'analyse du CTP quantifie l'accumulation réelle des coûts sur la durée de vie (coûts d'exploitation : 65 à 750 billions de KRW, coûts d'investissement : 20 à 300 billions de KRW, événements du cycle de vie : 5 à 100 billions de KRW) et permet un choix rationnel de la plateforme Ever-Power par rapport aux alternatives japonaises existantes. Les embouteilleurs coréens qui réalisent une analyse du CTP rigoureuse constatent systématiquement des économies de 4 à 5 milliards de KRW sur la durée de vie en faveur des plateformes Ever-Power nationales pour des scénarios de production comparables.
Cette approche consiste à recenser les sept catégories du coût total de possession (investissement, résine/consommables, main-d'œuvre, services publics, maintenance, temps d'arrêt, récupération en fin de vie), à identifier les coûts cachés souvent négligés lors des processus d'approbation budgétaire (traduction de la documentation, risque de change, obsolescence du système de contrôle, conversion électrique) et à modéliser l'évolution de ces catégories sur une période de 10 ans, plutôt que de supposer un coût annuel constant. Pour une analyse détaillée du coût total de possession et des exigences en matière de logistique d'installation et de mise en service en Corée, veuillez consulter notre Guide d'installation pour la Corée.
Principaux enseignements du coût total de possession (TCO) sur 10 ans
- ✓Le coût d'investissement ne représente que 20 à 30 000 TP3 000 $ du coût total de possession (TCO) sur 10 ans ; les coûts d'exploitation prédominent entre 65 et 75 000 TP3 000 $.
- ✓Sept catégories de coût total de possession (CTP) : capital, résine, main-d’œuvre, services publics, maintenance, temps d’arrêt, récupération en fin de vie
- ✓L'entretien suit une courbe en baignoire : 2-3% années 1-3, 3,5-4,5% années 4-5, 6-8% années 9-10+
- ✓Coût des temps d'arrêt : 8 à 15 millions de KRW/heure, soit 2 à 6 milliards de KRW sur une durée de vie de la plateforme de 10 ans.
- ✓Quatre catégories cachées : traduction, exposition aux effets de change, obsolescence, conversion électrique (15-20% de TCO)
- ✓Écart de coût total de possession (TCO) sur 10 ans entre la Corée et le Japon : 25-30% (environ 4 à 5 milliards de KRW) en faveur d’Ever-Power.
- ✓Principale source d'économies : coûts liés aux temps d'arrêt (1,3 à 1,5 milliard de KRW sur 10 ans avec un service local).
- ✓Six pratiques d'optimisation du coût total de possession (TCO) permettent de réaliser des économies annuelles potentielles de 300 à 500 millions de KRW sur toute la durée de vie du produit.
Demandez un modèle de coût total de possession (TCO) sur 10 ans pour votre décision de plateforme
Partagez votre volume de production, les spécifications de vos bouteilles, les détails de votre plateforme actuelle et l'alternative japonaise que vous évaluez. Notre équipe d'ingénieurs coréens vous fournira sous 48 heures un modèle comparatif complet du coût total de possession (CTP) sur 10 ans, incluant les sept catégories de coûts, l'identification des coûts cachés et une recommandation de plateforme.


