COST / ROI ANALYSIS
Total Cost of Ownership: 10-Year ISBM TCO Analysis for Korean Bottlers
Capital cost is only 20-30% of 10-year total ownership cost on an ISBM machine. Operating cost, maintenance, downtime, and obsolescence together dominate the lifetime economics. This guide builds a complete TCO model comparing Korean Ever-Power versus Japanese incumbent platforms across all cost categories, demonstrating where the 40-55% lifetime cost advantage actually comes from.
In This Guide
1. Why TCO Matters More Than Capital Cost
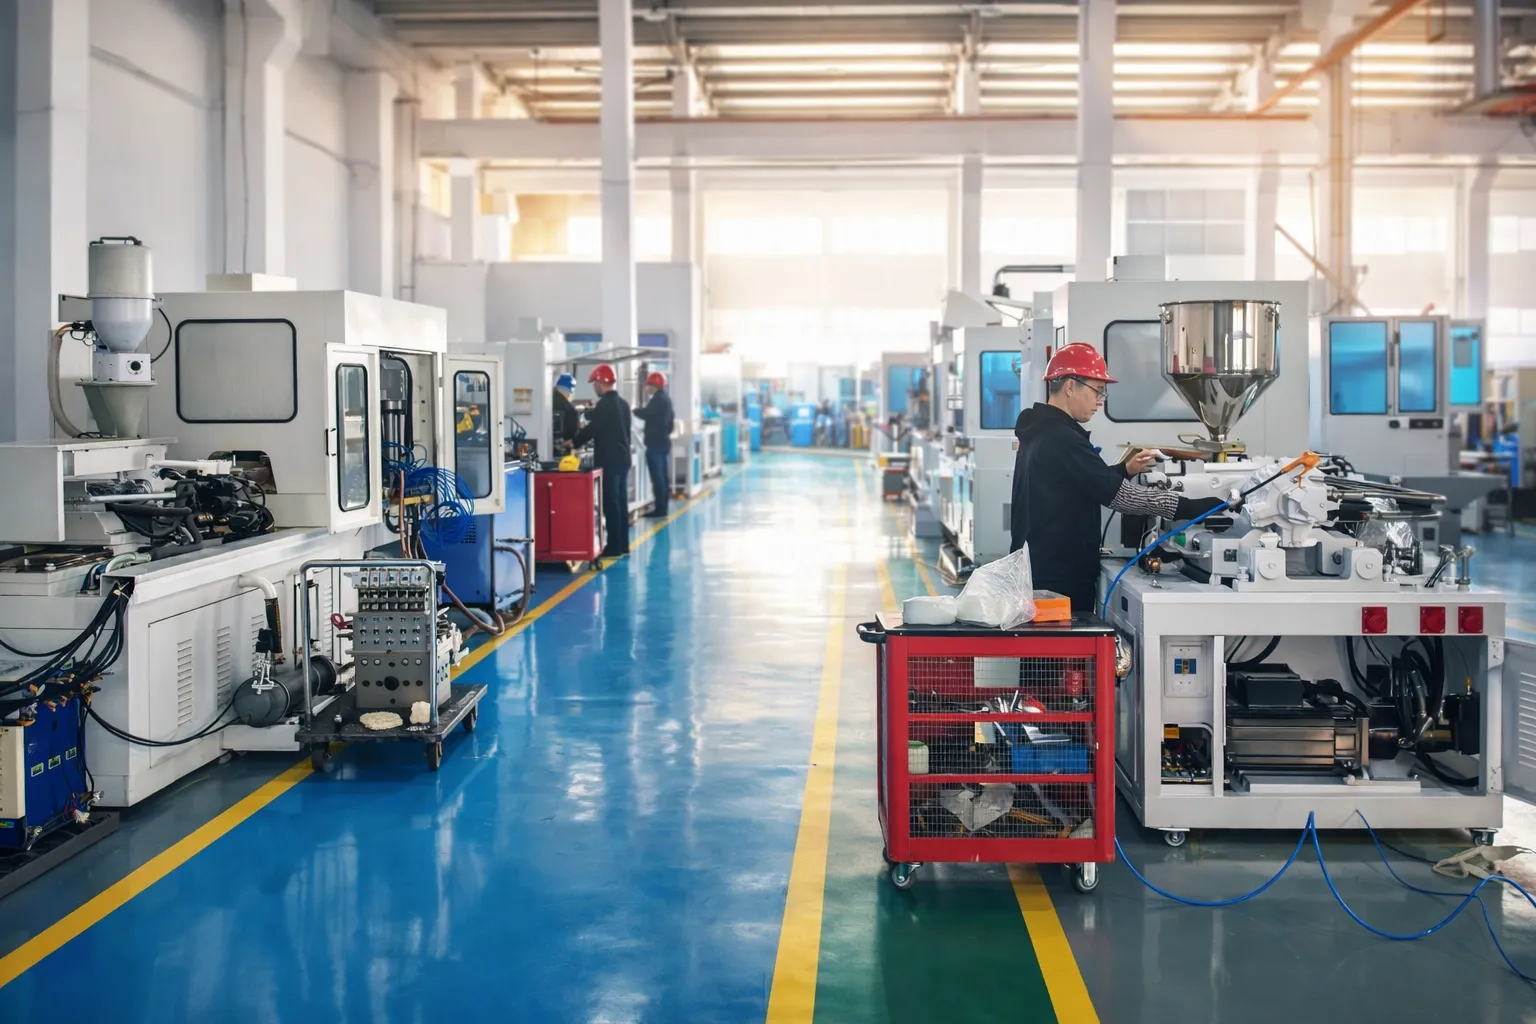
Korean ISBM bottling facility — capital cost represents only 20-30% of 10-year total ownership cost; operating cost and downtime dominate
Purchasing decisions based on capital cost alone regularly produce outcomes 30-50% more expensive across a 10-year machine life than the apparently “cheaper” option. Total Cost of Ownership (TCO) is the framework for comparing investment alternatives across the full ownership horizon, including capital acquisition, operating expenses, maintenance requirements, production downtime impact, and end-of-life disposal or resale values. For an ISBM machine with 10-15 year useful life, TCO analysis reveals the economics that justify or disqualify each purchase candidate.
Korean bottlers evaluating Ever-Power vs Japanese incumbent ASB or Aoki platforms encounter a specific TCO pattern: Japanese capital cost runs 60-100% above Ever-Power on direct machine pricing, while Japanese operating cost runs 18-35% above Ever-Power through higher energy consumption, reduced throughput per hour, and dependency on imported spare parts. Both factors compound across 10-year ownership to produce 40-55% lifetime TCO advantage for Korean Ever-Power platforms on typical production scenarios.
The TCO approach serves three decision-making functions beyond simple cost comparison. First, it exposes hidden cost categories that budget approval processes often miss (spare parts inflation, translation cost for Japanese documentation, training cost for non-native language operation). Second, it enables like-for-like comparison across alternatives with different capital vs operating cost profiles. Third, it quantifies the financial impact of lifecycle events (year-5 major overhaul, year-8 control system obsolescence, year-12 end-of-life resale or replacement) that simple payback calculation obscures. For foundational ROI methodology, review the companion ROI calculation framework guide before building TCO analysis on top.
2. Seven TCO Cost Categories
A complete TCO model captures seven distinct cost categories across the ownership lifecycle. Each category has different magnitude, timing, and predictability characteristics that require dedicated analysis.
1. Capital Acquisition Cost
Core machine, auxiliary equipment, mould tooling, installation, training. Incurred primarily in year 0 with small mould replenishment in years 4-6. Largest single cost event but smaller portion of lifetime economics than intuition suggests.
2. Resin & Consumables
PET resin, rPET blend components, cleaning chemicals, filter media, packaging supplies. Largest single category over 10 years. Machine-dependent variation through energy efficiency, wall thickness optimization potential, and scrap rate.
3. Labour Cost
Operator wages, supervisor time, quality control technicians. Korean minimum wage and labour inflation (3-5% annual) compounds across 10 years. Full-servo machines enable 1-position reduction per shift through PLC automation, worth roughly 150-200 M KRW annually.
4. Electricity & Utilities
KEPCO industrial electricity (110-140 KRW/kWh), chilled water, compressed air, cooling tower makeup water. Full-servo machines deliver 15-25% reduction on electricity line vs hydraulic equivalent. Korean electricity tariff inflation averages 2.5-4% annually.
5. Maintenance & Spare Parts
Scheduled maintenance, wear component replacement, spare parts kit replenishment, service contract fees. Grows progressively over machine life: 2-3% of capital in years 1-3, 4-6% in years 7-10. Korean domestic Ever-Power service drastically lower than Japanese imported parts dependency.
6. Production Downtime Cost
Lost contribution margin during unplanned shutdown and planned maintenance. Korean beverage line at 8-15 M KRW/hour exposure. Platform reliability and spare parts availability directly affect this category. Often the single largest hidden cost distinguishing domestic Korean vs imported Japanese platforms.
7. End-of-Life Resale / Scrap Value
Year-10 or year-15 resale to secondary market or scrap metal value. Well-maintained Ever-Power machines typically retain 12-18% of original capital at year 10. Japanese incumbent platforms retain 8-14% due to older control system obsolescence. This recovered value offsets portion of year-0 capital cost in TCO calculation.
3. Annual Operating Expense Breakdown
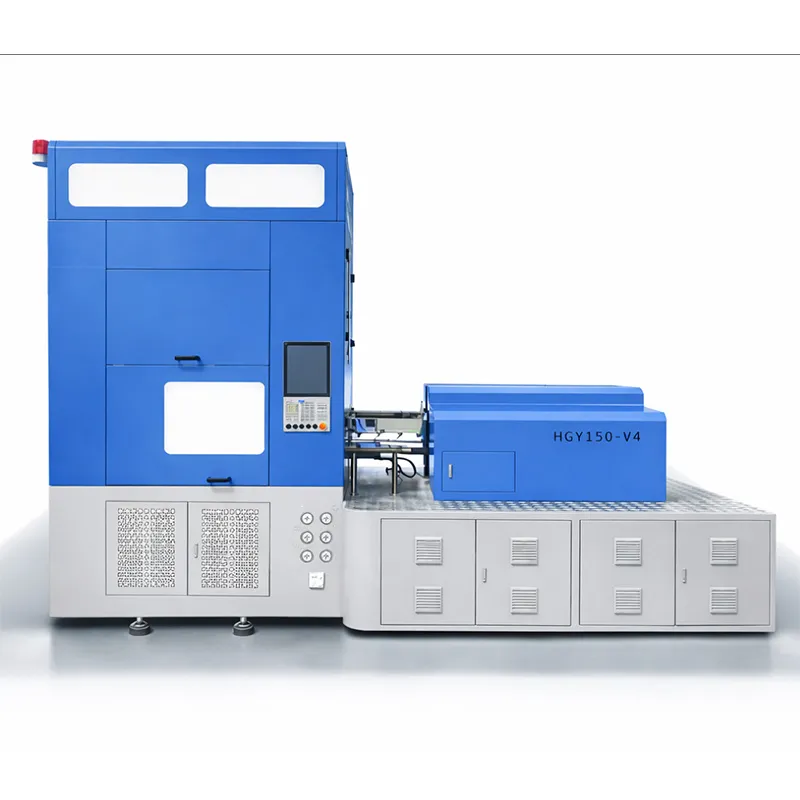
HGY150-V4 platform — representative annual operating cost approximately 1,170 M KRW at 25M bottle production volume
Annual OPEX calculation for a representative HGY150-V4 at 25M bottle annual production (500 ml water format, 6-cavity mould, 82% OEE):
| OPEX Line | Calculation | Annual (M KRW) |
|---|---|---|
| PET resin | 12g × 25M × 1,550 KRW/kg | 465 |
| Labour (3 shifts, 2 operators each) | 6 operators × 4.8 M/month × 12 | 346 |
| Electricity | 36 kW × 8,760 hr × 80% × 125 KRW | 31.5 |
| Compressed air (dedicated compressor) | 25 HP compressor operating cost | 48 |
| Chilled water / cooling | Chiller + tower + water makeup | 28 |
| Maintenance & spare parts | 2.5% of capital year 1-3, rising | 32 |
| Consumables (filters, lube, cleaning) | Ongoing consumable supply | 15 |
| Downtime cost (3% productive hours) | Unplanned + planned, margin loss | 185 |
| TOTAL ANNUAL OPEX | — | 1,150 |
Across 10 years with 3% annual inflation on labour and 2.5% on electricity, total 10-year OPEX approaches 12.8 B KRW. Capital cost 1.2 B represents only 8.6% of cumulative 10-year spend. OPEX is the dominant TCO component by a wide margin.
4. Maintenance Over Lifecycle
Maintenance cost follows a predictable bathtub curve across the machine ownership life. Early years (1-3) see low maintenance cost as wear components are fresh. Middle years (4-7) experience steady maintenance cost. Late years (8-10+) see rising cost as cumulative wear accumulates and control system components approach end-of-life.
Typical maintenance cost progression:
- ✓Year 1: 1.5-2.0% of capital cost; warranty coverage absorbs most unplanned events
- ✓Year 2-3: 2.5-3.0% of capital cost; first wear components reaching replacement schedule
- ✓Year 4-5: 3.5-4.5% including first major overhaul (cycle 2.5-3M cycles); hydraulic seal replacements, platen alignment
- ✓Year 6-8: 4.5-6.0%; servo drive refurbishment, injection screw/barrel replacement, control system component aging
- ✓Year 9-10+: 6.0-8.0%; second major overhaul, control system upgrade or end-of-life decision point
Imported vs Domestic Spare Parts Cost
Japanese platform spare parts typically cost 2.2-3.5× the domestic Ever-Power equivalent due to import margin, customs, and currency exposure. A 4.5 M KRW hydraulic cylinder seal kit from Japan equivalent to a 1.5 M KRW Korean kit creates compounding cost disadvantage over 10 years of sustained maintenance spend.
5. Downtime & Production Loss Cost
Production downtime represents the single most underestimated TCO category. Korean bottlers running 24/7 production lose 8-15 M KRW in contribution margin per line-hour during unplanned shutdown. Aggregate downtime of 3-5% of productive hours annually translates to 260-430 hours per year, generating 2-6 B KRW accumulated downtime cost over 10 years.
Unplanned downtime is often the largest TCO differentiator between Korean domestic Ever-Power and Japanese incumbent platforms
Downtime cost factors:
- ▸Spare parts delivery time: 2-5 days vendor delivery adds direct production loss proportional to downtime duration
- ▸Service technician availability: Korean local Ever-Power engineering 24-48 hour response vs Japanese vendor 3-5 day dispatch
- ▸Spare parts kit availability: on-site 8-11 M KRW kit eliminates 60-70% of spare parts delivery delay
- ▸Customer penalty clauses: Korean beverage brand contracts increasingly include line-stop penalties of 15-30 KRW per unit of shortfall
- ▸Inventory buffer requirement: higher downtime variability forces higher safety stock carrying cost at downstream filling lines
6. Hidden Cost Categories Often Missed
Standard TCO templates capture 80-85% of true ownership cost. The remaining 15-20% hides in categories that budget approval processes routinely overlook. Korean bottlers performing post-mortem TCO analysis frequently discover these hidden categories account for the gap between projected and actual lifetime cost.
Documentation & Language Translation
Japanese machine documentation typically in Japanese or English requiring Korean translation for Korean operator use. Translation quality for technical content affects training effectiveness and troubleshooting accuracy. Annual cost: 5-15 M KRW for translation services, technical manual updates, and SOP development from imported documentation.
Exchange Rate Exposure
USD/KRW and JPY/KRW rate variation affects imported spare parts cost and ongoing service fees for Japanese platforms. 10% KRW weakening translates to 10% higher spare parts cost in local currency. Hedging cost typically 1-2% of imported spend annually to manage exchange rate risk.
Control System Obsolescence
PLC and HMI components reach end-of-life support after 7-10 years for most vendors. Continued operation requires spare parts from scrapped units, specialty refurbished markets, or full control system retrofit at 180-350 M KRW. Korean Ever-Power uses current-generation Siemens/Mitsubishi PLC with standard 15+ year lifecycle support.
Electrical Conversion & Installation
Japanese platforms ship at 200V/50Hz native specification; Korean 380V/60Hz infrastructure requires transformer conversion costing 25-45 M KRW plus ongoing 1-2% electrical efficiency loss. Ever-Power ships 380V/60Hz native; no conversion required. Compound savings over 10 years: 15-30 M KRW in transformer cost and cumulative electricity loss.
7. Korean vs Japanese 10-Year TCO
Direct TCO comparison between Korean Ever-Power HGY150-V4 and representative Japanese ASB-12M-level platform reveals where the lifetime cost advantage accumulates. All figures in billion KRW for 10-year ownership of comparable 4-station ISBM platform producing 25M bottles annually. See HGY150-V4 specifications for current pricing reference.
| TCO Category | Ever-Power (B KRW) |
Japanese (B KRW) |
Korean Savings |
|---|---|---|---|
| Capital acquisition (year 0) | 1.24 | 2.15 | 0.91 |
| PET resin (10-yr cumulative) | 5.10 | 5.25 | 0.15 |
| Labour (10-yr with inflation) | 3.05 | 3.60 | 0.55 |
| Electricity & utilities | 0.82 | 1.12 | 0.30 |
| Maintenance & spares | 0.55 | 1.18 | 0.63 |
| Downtime cost | 1.85 | 3.20 | 1.35 |
| Hidden costs (translation, FX, obsolescence) | 0.08 | 0.47 | 0.39 |
| End-of-life recovery (negative) | (0.18) | (0.22) | (0.04) |
| 10-YEAR TCO TOTAL | 12.51 | 16.75 | 4.24 |
The 4.24 B KRW Korean savings represents 25.3% reduction in 10-year TCO, distributed across capital cost (0.91 B), labour (0.55 B), utilities (0.30 B), maintenance (0.63 B), downtime (1.35 B), and hidden costs (0.39 B). Downtime cost accounts for the largest single saving category because Korean local service network compresses mean-time-to-repair substantially versus Japanese imported service dependency.
8. TCO Optimization Strategies
Beyond platform selection, Korean bottlers can actively optimize TCO through six operational and procurement practices that deliver compounding lifetime savings.
TCO optimization practices:
- ✓Preform mass optimization: 3-5% mass reduction saves 140-250 M KRW/year on resin at 25M bottle volume
- ✓Full-servo specification: 15-25% electricity savings + labour reduction compound to 50-70 M KRW annual advantage
- ✓On-site spare parts kit: 8-11 M KRW kit investment saves 12-24 days downtime annually = 150-400 M KRW
- ✓Preventive maintenance schedule: scheduled replacement beats reactive replacement by 30-50% cost factor
- ✓rPET blend capability: K-EPR compliance capex recovered through non-compliance penalty avoidance within 2-3 years
- ✓Korean local service contract: 24-48 hour response cuts downtime cost by 60-70% vs overseas dispatch
9. Complete TCO Case Study
Korean bottler case study — 10-year TCO comparison drives strategic platform selection decision with 4+ billion KRW lifetime cost differential
Case: Busan Beverage Bottler Platform Decision
Situation: Korean beverage contract filler in Busan adding third ISBM line for capacity expansion. Evaluating Ever-Power HGY150-V4 versus Japanese ASB-12M equivalent platform for 500 ml water bottle production at 28M annual units.
Decision context:
- Capital budget approved at 2.0 B KRW ceiling
- Production volume commitment from downstream brand customer
- Existing facility has 2 Japanese ASB-12M machines aged 8 and 11 years
- CFO requested full 10-year TCO analysis before purchase authorization
TCO analysis results (10-year window):
- Ever-Power HGY150-V4 10-year TCO: 13.42 B KRW
- Japanese ASB-12M equivalent 10-year TCO: 17.95 B KRW
- Ever-Power savings: 4.53 B KRW (25.2% reduction)
Key differentiators:
- Capital savings: 920 M KRW (Ever-Power 1.19 B vs Japanese 2.11 B)
- 10-year downtime savings: 1.48 B KRW (Korean local service advantage)
- Labour savings: 610 M KRW (full-servo 1-operator reduction)
- Maintenance savings: 690 M KRW (domestic spare parts cost advantage)
- Electricity savings: 340 M KRW (full-servo 15-25% reduction)
- Hidden cost savings: 450 M KRW (no transformer, no translation, no FX exposure)
The CFO approved Ever-Power platform selection based on rigorous TCO analysis that surfaced 4.53 B KRW lifetime cost advantage invisible in capital cost comparison alone. The bottler committed to Ever-Power platform with 18-month lead time for delivery and commissioning; Japanese platform comparison was dropped before formal quotation request.
10. Conclusion
Total Cost of Ownership analysis reveals the lifetime economics that capital cost comparison fundamentally misses. For Korean ISBM investment decisions involving 1.2-2.5 B KRW capital exposure across 10+ year operational life, TCO analysis quantifies where lifetime cost actually accumulates (operating cost 65-75%, capital cost 20-30%, lifecycle events 5-10%) and enables rational platform selection across Ever-Power versus Japanese incumbent alternatives. Korean bottlers performing disciplined TCO analysis consistently identify 4-5 B KRW lifetime savings favouring domestic Ever-Power platforms for comparable production scenarios.
The discipline involves capturing all seven TCO categories (capital, resin/consumables, labour, utilities, maintenance, downtime, end-of-life recovery), tracking hidden cost categories that budget approval processes routinely miss (documentation translation, exchange rate exposure, control system obsolescence, electrical conversion), and modeling category progression across the 10-year window rather than assuming constant annual cost. For the final TCO-to-deployment bridge covering Korean installation logistics and commissioning requirements, see our Korea Installation Guide.
10-Year TCO Key Takeaways
- ✓Capital cost is only 20-30% of 10-year TCO; operating cost dominates at 65-75%
- ✓Seven TCO categories: capital, resin, labour, utilities, maintenance, downtime, end-of-life recovery
- ✓Maintenance follows bathtub curve: 2-3% years 1-3, 3.5-4.5% years 4-5, 6-8% years 9-10+
- ✓Downtime cost: 8-15M KRW/hour, accumulating 2-6B KRW across 10-year platform life
- ✓Four hidden categories: translation, FX exposure, obsolescence, electrical conversion (15-20% of TCO)
- ✓Korean vs Japanese 10-year TCO gap: 25-30% (roughly 4-5B KRW) favouring Ever-Power
- ✓Largest savings category: downtime cost (1.3-1.5B KRW over 10 years from local service)
- ✓Six TCO optimization practices deliver 300-500M KRW annual lifetime savings potential
Request a 10-Year TCO Model for Your Platform Decision
Share your production volume, bottle specifications, existing platform details, and incumbent Japanese alternative under evaluation. Our Korean engineering team returns a complete 10-year TCO comparison model with all seven cost categories, hidden cost identification, and platform recommendation within 48 hours.


