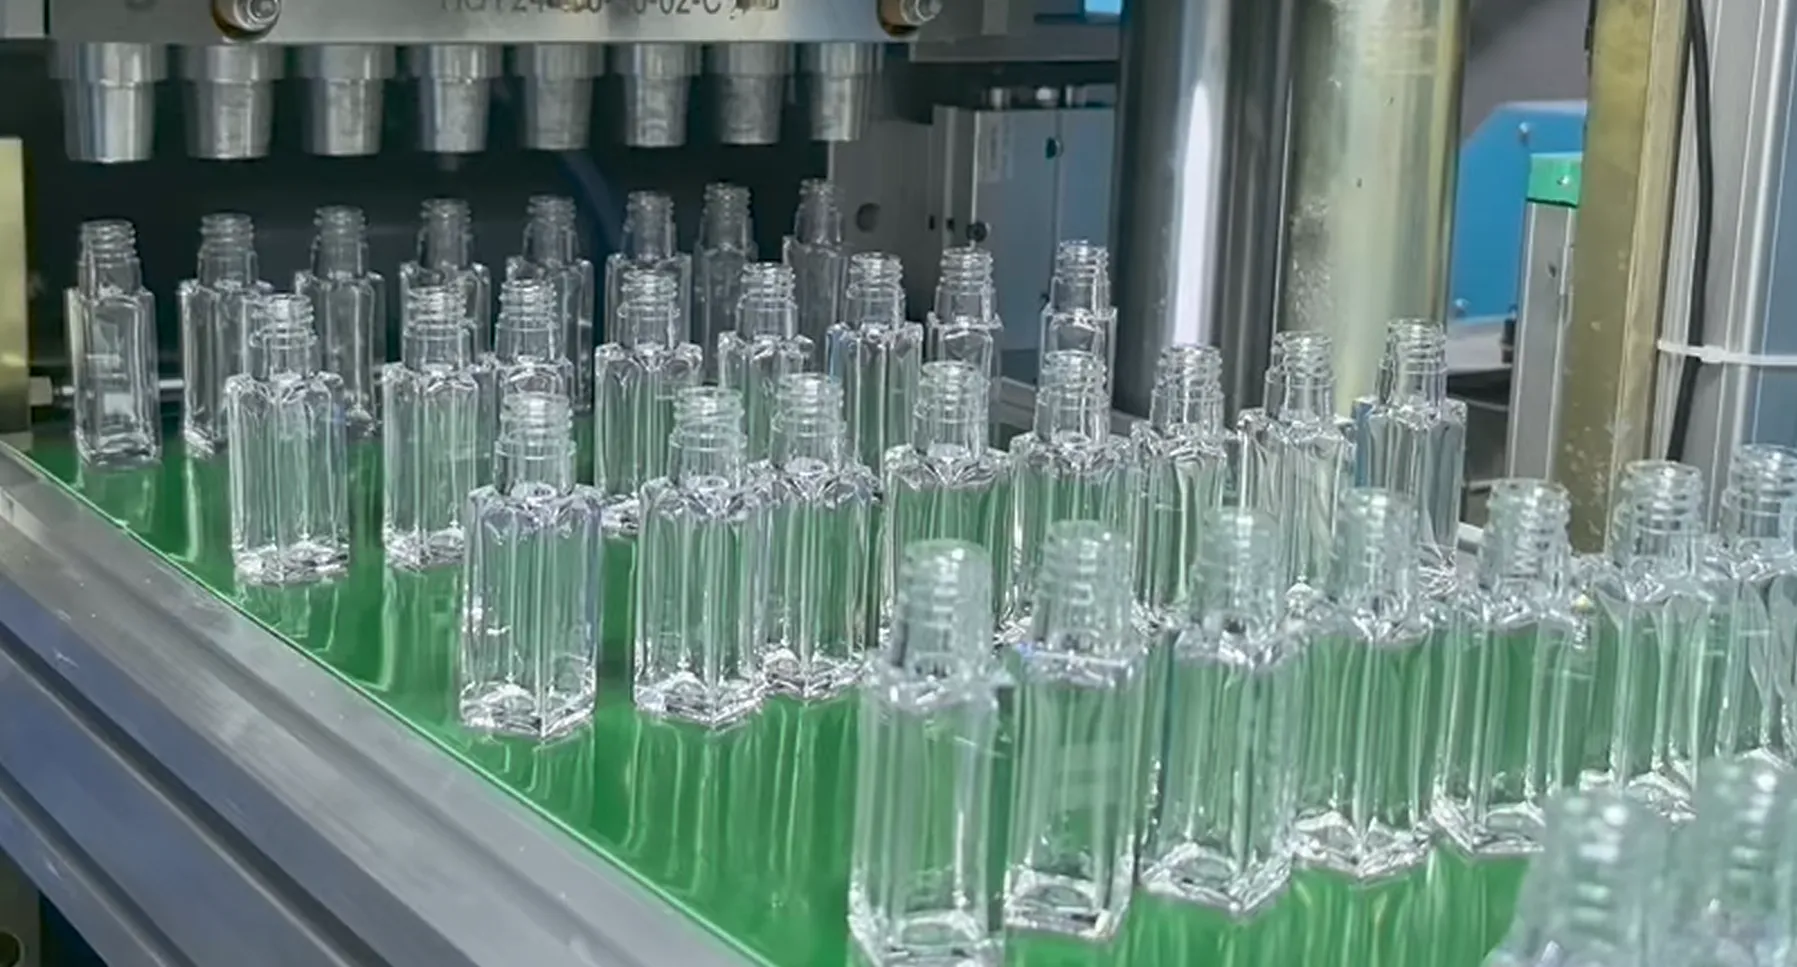
비용 절감 프레임워크
한국 ISBM 생산 불량률 감소: 40-60% 감축 프레임워크
2%의 불량률은 5~10%의 수익 마진을 잠식합니다. 연간 1천만 병 생산 라인에서 불량률을 2.5%에서 0.8%로 줄이면 연간 약 3억 6백만 원을 절감할 수 있습니다. 본 프레임워크는 한국 제조업체들이 90일 이내에 불량률을 40~60%까지 줄이는 데 사용하는 5단계 방법론을 문서화하고, 플랫폼 영향 분석 및 세 가지 실제 사례 연구를 제시합니다.
요약 — 빠른 요약
한국 산업의 불량률 벤치마크는 세계 최고 수준인 0.3~0.8%, 경쟁력 있는 수준인 0.8~1.5%, 평균 수준인 1.5~2.5%, 평균 이하 수준인 2.5% 이상으로 나타납니다. 총 불량 비용은 인건비, 에너지 비용, 그리고 후속 공정 손실을 고려하면 재료비의 3~5배에 달합니다. 불량률 저감은 5단계 프레임워크를 통해 달성할 수 있습니다: 측정(기준선 설정), 분석(4가지 근본 원인 파악), 개선(매개변수 수정 적용), 모니터링(통계적 공정 관리(SPC) 구현), 유지(운영자 교육). HGY150-V4-EV와 같은 풀서보 플랫폼은 일반적으로 유압식 플랫폼보다 불량률이 0.5~1.0%포인트 낮습니다. 자동 비전 검사를 통해 불량률 통과를 0.1% 미만으로 줄일 수 있습니다. 기존 생산 라인에서 90일 이내에 40~60%의 불량률 감소가 예상됩니다.
이 틀 안에서
1. 폐기율이 가장 큰 숨겨진 비용인 이유
한국의 ISBM(단일 병 제조) 업체들은 일반적으로 불량률이 수익성에 미치는 영향을 과소평가합니다. 불량률이 2.51톤인 생산 라인은 원자재 비용 2.51톤만 손실되는 것처럼 보입니다. 그러나 실제로는 모든 불량 병에는 인건비, 에너지 비용, 감가상각비, 그리고 최종 가공 비용이 포함되어 있기 때문에, 불량품 발생 시에도 나머지 97.51톤의 불량품 생산 과정에서 발생하는 비용이 고스란히 흡수되어 5~101톤의 이익 마진 손실로 이어집니다.
규모가 커질수록 경제적 효과는 명확해집니다. 연간 1천만 병을 생산하는 500ml 생수 생산 라인의 경우, 병당 180원으로 계산하면 완제품 가치는 18억 원입니다. 불량률을 2.51톤에서 0.81톤으로 낮추면(아래 프레임워크에서 달성 가능한 수준) 연간 약 3억 6백만 원을 절감할 수 있습니다. 연간 5천만 병 생산 라인의 경우, 절감액은 15억 원을 넘어섭니다. 이 수치는 이론적인 것이 아니라, 체계적인 불량률 감축 프로그램을 완료한 한국 제조업체들의 실제 결과입니다.
스크랩 감소는 재료비 계산에 잘 나타나지 않는 세 가지 간접적인 이점을 가져옵니다. 첫째, 스크랩 병이 소모하던 공정 시간을 활용하여 판매 가능한 제품을 생산할 수 있게 되므로 생산량이 증가합니다. 둘째, 공정 관리가 개선되어 불량품이 검사를 통과하는 경우가 줄어들기 때문에 고객 불량률이 감소합니다. 셋째, 일관된 품질 유지로 교대 근무 중 발생하는 문제 해결 부담이 줄어들어 작업자의 사기가 향상됩니다. 지속적인 스크랩 감소로 인한 총 가치는 일반적으로 직접적인 재료비 절감액의 2~3배에 달합니다.
2. 한국 산업 벤치마크
생산량 감축을 시도하기 전에 생산자는 자사 제품이 한국 산업 표준 대비 어느 수준에 속하는지 파악해야 합니다. 다음 등급은 2025-2026년 한국 생산자들의 실제 불량률을 반영한 것입니다.
| 성능 등급 | 폐기율 범위 | 일반적인 프로필 |
|---|---|---|
| 세계적 수준 | 0.3-0.8% | 완전 서보, 안정적인 파라미터, 프리미엄 애플리케이션 |
| 경쟁 등급 | 0.8-1.5% | 한국의 중견 생산업체인 SPC는 규율을 중시합니다. |
| 업계 평균 | 1.5-2.5% | 표준 유압 플랫폼, 반응형 품질 관리 |
| 평균 이하 | 2.5%+ | 노후 장비, 일관성 없는 공정 관리 |
한국의 K-뷰티 및 제약 제조업체들은 프리미엄 가격 책정으로 인해 풀서보 플랫폼 투자와 엄격한 공정 관리가 가능해지면서 0.3~0.8%의 낮은 불량률을 꾸준히 기록하며 업계를 선도하고 있습니다. 음료 원료 제조업체들은 가격 압박으로 장비 투자가 제한되어 일반적으로 1.0~1.8%의 불량률을 보입니다. 다양한 SKU 포트폴리오를 보유한 위탁 충전기업체들은 잦은 제품 교체로 인해 공정 변동이 발생하여 평균 1.5~2.5%의 불량률을 나타냅니다.
생산 라인의 TP3T가 1.51을 초과하는 경우, 이 가이드에 제시된 프레임워크를 체계적으로 적용하면 일반적으로 90일 이내에 40~60%를 감축할 수 있습니다. 생산 라인의 TP3T가 2.51을 초과하는 경우에는 여러 매개변수 범주가 동시에 제어 불능 상태에 빠지기 때문에 감축 잠재력이 60%를 초과하는 경우가 많습니다.
3. 폐기물의 실제 비용: 재료비의 3~5배
대부분의 생산자는 폐기물 비용을 원자재 비용으로만 계산합니다. 이는 실제 영향을 크게 과소평가하는 것입니다. 적절한 폐기물 비용 모델은 총 영향에 의미 있는 영향을 미치는 다섯 가지 비용 구성 요소를 포함해야 합니다.
| 비용 구성 요소 | 총 폐기물 비용 % | 전형적인 한국적 가치관 |
|---|---|---|
| 원자재 비용 | 25-35% | 500ml 병당 10~15원 |
| 노동비용 흡수 | 15-20% | 병당 5~9원 |
| 에너지 소비량 | 10-15% | 병당 4~6원 |
| 기계 감가상각 | 10-15% | 병당 4~6원 |
| 하류 영향 | 20-30% | 재작업, 고객 크레딧, 일정 차질 |
| 총 폐기 비용 | 100% | 병당 40~50원 (3~4개입) |
하류 부문에 미치는 영향은 가장 과소평가되는 요소입니다. 최종 검사에서 불량품이 발견되면 생산 자원이 완전히 소모됩니다. 하지만 불량품이 고객에게 전달되면 환불 처리, 고객 현장에서의 재작업, 그리고 브랜드 평판 손상으로 이어집니다. 고객이 발견한 결함은 일반적으로 내부 불량 처리 비용보다 3~5배 더 큰 손실을 초래하는데, 이는 고객이 충전 라인 운영에 차질을 감수해야 하기 때문입니다.
연간 1천만 병 생산 라인에서 폐기율이 2.5%인 경우, 연간 총비용 영향은 폐기 병 25만 개 × 평균 총비용 약 45원 = 1,125만 원으로, 직접적인 비용 손실이 발생하며, 여기에 간접비용(일반적으로 이 금액의 두 배)을 더하면 연간 총비용 손실은 2,200만~3,000만 원 이상이 됩니다. 폐기율을 체계적으로 0.8%까지 줄이면 이러한 비용의 대부분을 절감할 수 있습니다.
4. 네 가지 근본 원인 범주
불량품 감소는 체계적인 진단에서 시작됩니다. 모든 결함은 네 가지 근본 원인 범주 중 하나로 귀결됩니다. 불량품 감소 프로그램의 첫 번째 단계는 각 범주에서 발생하는 불량품의 비율을 측정하고, 가장 큰 원인부터 해결하는 것입니다.
| 근본 원인 범주 | 일반적인 총 폐기물량 % | 결함 보장 범위 |
|---|---|---|
| 사전 온도 제어 | 35-45% | 진주광택, 흐림, 벽 두께, 상단 적재 |
| 재료의 수분 함량 및 품질 | 15-25% | 흐릿함, 황변, 미세한 구멍, 누출 |
| 금형 냉각 및 상태 | 15-25% | 로커 바텀, 타원형, 기저 결정화 |
| 주입 및 핫러너 매개변수 | 15-20% | 게이트 자국, 넥 변형, 응력 균열 |
대부분의 한국 제조업체에서 프리폼 온도 관리 문제는 가장 흔한 불량 유형(펄 현상, 헤이즈, 벽 두께 편차)을 유발하기 때문에 불량률의 가장 큰 부분을 차지합니다. 이 문제를 먼저 해결하면 전체 불량률을 일반적으로 15~25%포인트 줄일 수 있습니다.
결함별 상세 진단 프로토콜 및 수정 매개변수는 다음을 참조하십시오. ISBM 병에서 흔히 발생하는 15가지 결함과 해결 방법이 보조 참조 자료는 각 결함 범주에 대한 구체적인 매개변수 조정 방법을 제공합니다.
5. 5단계 축소 프레임워크
40~60%의 스크랩 감축을 달성한 한국 제조업체들은 체계적인 5단계 방법론을 따르고 있습니다. 각 단계는 이전 단계를 기반으로 하며, 단계를 건너뛰면 일시적인 개선 효과가 나타나지만 몇 주 안에 다시 악화됩니다.
1단계: 측정 (1일~14일)
목적: 신뢰할 수 있는 불량품 기준선과 불량 분포를 설정합니다.
행위: 불량 유형별로 14일간의 불량품 데이터를 수집합니다. 각 불량 유형을 사진으로 촬영하여 시각적 참조 라이브러리를 구축합니다. 기준 불량률과 불량 파레토 차트를 작성합니다. 불량 발생량 기준으로 상위 3개 불량 유형을 파악합니다. 비교를 위해 현재 매개변수 설정을 기록합니다.
2단계: 분석 (15~21일차)
목적: 주요 결함을 근본 원인 범주에 매핑합니다.
행위: 4가지 범주로 구성된 근본 원인 분석 프레임워크를 각 주요 결함에 적용합니다. 사양을 벗어난 매개변수를 식별합니다. 각 범주를 수정했을 때 예상되는 영향을 계산합니다. 가장 큰 영향을 미치는 범주부터 우선적으로 수정하는 우선순위 수정 계획을 수립합니다.
3단계: 해결 (22일~45일)
목적: 매개변수를 수정하고 불량률 감소를 검증하십시오.
행위: 특정 매개변수 수정 사항을 한 번에 한 범주씩 적용합니다. 각 수정 후 8시간 동안 검증 작업을 수행합니다. 측정 가능한 개선 효과를 가져온 수정 사항을 기록합니다. 결과 개선에 효과가 없었던 수정 사항은 되돌립니다. 3단계 종료 시점까지 20~30%의 불량률 감소를 목표로 합니다.
4단계: 모니터링 (46일~75일)
목적: 회귀 현상을 방지하기 위해 통계적 공정 관리(SPC)를 시행하십시오.
행위: 4~6개의 주요 매개변수(프리폼 온도, 금형 냉각 온도, 사이클 시간, 중량)에 대한 SPC 차트를 작성합니다. 작업 환경에 따라 시간별 또는 교대 근무별로 모니터링합니다. 2시그마에서 경고 임계값을, 3시그마에서 개입 임계값을 설정합니다. 가능한 경우 데이터 수집을 자동화합니다. 추가로 15~20%의 불량률 감소를 목표로 합니다.
5단계: 유지 (76~90일)
목적: 운영자 교육 및 문서화를 통해 성과를 확고히 하세요.
행위: 최적화된 파라미터 설정을 새로운 기준선으로 문서화합니다. 모든 작업자에게 SPC 모니터링 및 대응 프로토콜 교육을 실시합니다. 교대 근무자가 참조할 수 있도록 시각적 결함 라이브러리를 구축합니다. 변동을 방지하기 위해 매월 파라미터 감사를 실시합니다. 모든 이해관계자에게 매월 불량률 대시보드를 제공합니다.
6. 한국 사례 연구 3가지
사례 A: 경기 K뷰티 프로듀서
75일 만에 폐기율이 2.2%에서 0.7%로 감소
기준선: 250ml PETG 화장품 용기의 불량률은 2.2%이며, 이는 주로 진주광택(45%)과 벽 두께 편차(30%)에 기인합니다.
행위: 프리폼 컨디셔닝 프로파일 재보정(기준 영역에서 +3°C), 스트레치 로드 정렬 검증(중심 편차 0.35mm에서 0.12mm로 감소), 교대 근무당 4개 매개변수에 대한 SPC 모니터링 도입.
결과: 75일차에 0.7%의 불량률을 달성했으며, 6개월 추적 측정 기간 동안 이를 유지했습니다. 연간 2천만 병 생산 기준 약 4억 2천만 원의 비용 절감 효과를 거두었습니다.
사례 B: 부산 음료 제조업체
90일 동안 폐기율이 3.1%에서 1.3%로 감소
기준선: K-EPR 규정을 준수하기 위한 30%의 rPET 함량을 가진 500ml PET 생수병에서 3.1%의 폐기율이 발생했으며, 이는 주로 혼탁(40%)과 황변(25%)에 기인합니다.
행위: rPET 혼합 소재의 건조 온도를 165°C에서 172°C로 높이고, 열분해 방지를 위해 배럴 온도를 5°C 낮추고, 오염 제거를 위해 용융 필터를 80메쉬로 업그레이드하고, 핫 러너 노즐 온도를 8°C 낮췄습니다.
결과: 90일차에 1.3%의 폐기율을 달성했습니다. 2단계에서 폐기율을 1.0% 미만으로 추가 감소시키기 위해 플랫폼을 풀서보 방식으로 업그레이드하는 것을 권장합니다.
사례 C: 대구 계약 이행 담당자
60일 동안 폐기율이 2.6%에서 1.1%로 감소
기준선: 18개 SKU 화장품 포트폴리오(100~500ml 범위)에서 2.6%의 불량률이 발생했으며, 이는 주로 제품 교체 과정에서의 결함(50%)과 치수 편차(25%)에 기인합니다.
행위: 표준화된 전환 프로토콜을 통해 첫 시간 내 불량률 급증을 줄이고, SKU별 기준 파라미터 라이브러리를 구축했으며, 파라미터 재설정 절차에 대한 작업자 교육을 실시했습니다. 2단계에서는 HGY150-V4-EV 풀서보 플랫폼으로 변경하여 캐비티 간 일관성을 더욱 향상시켰습니다.
결과: 공정 개선만으로 60일 만에 1.1%의 불량률을 달성했습니다. 2단계 플랫폼 업그레이드를 통해 불량률을 0.7% 범위까지 더욱 낮출 것으로 예상됩니다.
7. 플랫폼 선택의 영향
장비 플랫폼은 달성 가능한 불량률에 상당한 영향을 미칩니다. 완전 서보 플랫폼은 서보 드라이브가 생산 교대 시간 동안 더 높은 파라미터 안정성을 제공하기 때문에 유압식 플랫폼보다 불량률이 0.5~1.0%포인트 더 낮게 유지됩니다.
| 플랫폼 유형 | 일반적인 불량률 범위 | 핵심 이점 |
|---|---|---|
| 풀서보(HGY150-V4-EV) | 0.5-1.0% | 사이클 시간 안정성 ±0.2초 |
| 하이브리드 서보/유압식(HGY150-V4) | 0.8-1.5% | 정확성과 비용의 균형 |
| 표준 유압 | 1.5-2.5% | 초기 투자 비용 절감 |
| 오래되거나 낡은 장비(15년 이상) | 2.5-4.0% | 완전히 감가상각되었지만 낭비가 심함 |
15년 이상 유압식 플랫폼을 운영하는 제조업체의 경우, 완전 서보 시스템으로 업그레이드하는 것은 불량률 감소 측면에서 경제적으로 매우 유리한 경우가 많습니다. 연간 2천만 병 생산 라인에서 불량률을 3.0%에서 1.0%로 낮추면 연간 약 4억 원을 절감할 수 있으며, 일반적으로 플랫폼 투자 비용은 18~30개월 내에 회수됩니다.
프리미엄 풀서보 플랫폼 HGY150-V4-EV 이 장비는 0.5~0.8%의 불량률 목표치를 요구하는 용도에 맞게 특별히 설계되었습니다. 적용 분야는 K-뷰티 면세점, 제약 GMP, 프리미엄 수출 음료 브랜드 등 품질 일관성이 요구되는 곳으로, 이러한 분야에서는 프리미엄급 장비가 필요합니다.
8. 품질 관리 기술
현대 품질 관리 기술은 수동 검사를 넘어 발전했습니다. 세 가지 기술 범주는 결함을 감지하고 불량품이 그대로 통과하는 것을 방지함으로써 불량률 감소에 기여합니다.
자동 비전 검사
비전 시스템은 분당 최대 1,200개의 병을 검사하며 99.9% 이상의 정확도를 자랑합니다. 이 기술은 일반적인 수동 검사 정확도인 2~3% 대비 불량률을 0.1% 미만으로 낮춥니다. 수출 시장이나 프리미엄 국내 브랜드를 대상으로 하는 한국 제조업체들은 특히 K-뷰티 및 제약 분야에서 비전 검사를 기본 품질 관리 기준으로 점점 더 많이 채택하고 있습니다.
실시간 파라미터 모니터링
통합 파라미터 모니터링 시스템은 주요 변수(프리폼 온도, 금형 냉각 유량, 사이클 시간, 중량 편차)를 지속적으로 추적합니다. 파라미터가 관리 한계를 벗어나면 결함이 발생하기 전에 작업자에게 경고가 전송됩니다. 이러한 예방적 접근 방식은 일반적으로 사후 모니터링에 비해 불량률을 15~25%까지 줄여줍니다.
무게별 분류
병 출구에 설치된 중량 검사기는 규격 범위를 벗어난 중량 편차를 감지합니다. 중량 편차는 종종 아직 결함으로 나타나지 않은 병벽 두께 문제와 관련이 있습니다. 중량 기반 선별을 통해 불량 병을 고객에게 도달하기 전에 걸러내어 후속 공정에서 발생하는 불량품 발생 위험을 상당한 비용 절감 효과와 함께 줄일 수 있습니다.
9. 90일 실행 로드맵
다음 90일 로드맵은 5단계 프레임워크를 실행 가능한 주간 단위로 구체화한 것입니다. 이 일정을 준수하는 한국 생산 업체는 90일 차에 40~601톤의 폐기물 감축을 꾸준히 달성할 수 있습니다.
| 타임라인 | 단계 | 주요 조치 |
|---|---|---|
| 1-2주차 | 측정하다 | 기준선 스크랩, 결함 파레토, 매개변수 로그 |
| 3주차 | 분석하다 | 근본 원인 파악 및 개선 우선순위 설정 |
| 4주차~6주차 | 고치다 | 1단계 수정 사항을 적용하고, 검증하고, 문서화합니다. |
| 7주차~9주차 | 고치다 | 나머지 카테고리 수정 사항을 적용합니다. |
| 10주차-11주차 | 감시 장치 | SPC 차트 구현, 경고 임계값 |
| 12-13주차 | 지속시키다 | 운영자 교육, 문서화, 대시보드 |
각 단계별로 폐기물 감축 활동에 20~30%의 작업자 시간을 투자해야 합니다. 업무 외 시간에 폐기물 감축을 시도하는 공장은 일반적으로 15~25%의 감축 효과만 보이는 반면, 전담 프로그램을 운영하면 40~60%의 감축 효과를 얻을 수 있습니다. 이러한 시간 투자는 대부분의 한국 제조업체에서 10:1 이상의 투자 수익률(ROI)을 제공합니다.
10. 자주 묻는 질문
질문: 완전 자동 작동 장비로 업그레이드하지 않고도 세계 최고 수준의 폐기율을 달성할 수 있을까요?
1.0~1.5%의 불량률 달성은 이미 검증된 유압 플랫폼에서 공정 관리만으로도 가능합니다. 하지만 0.8% 이하를 달성하려면 일반적으로 서보 드라이브의 정밀도가 요구되는데, 이는 유압 드라이브로는 교대 근무 중 발생하는 온도 변화로 인해 ±0.2초의 사이클 타임 안정성을 유지하기 어렵기 때문입니다. 세계 최고 수준의 불량률 목표(0.3~0.8%)를 달성하려면 플랫폼 업그레이드를 통해 공정 개선만으로는 달성 기간을 12~18개월 단축할 수 있습니다.
질문: 비전 검사 시스템의 가격은 얼마이며, 투자 회수 기간은 얼마나 되나요?
한국 ISBM 라인용 표준 비전 검사 시스템은 속도 및 검출 복잡성에 따라 8천만 원에서 1억 8천만 원까지 가격대가 형성되어 있습니다. 연간 2천만 병 생산 라인에서 불량률을 2%에서 0.1%로 줄일 경우, 고객 불량률 감소만으로도 투자 회수 기간은 12~18개월에 달합니다. 프리미엄 제품(K-뷰티 면세점, 의약품)의 경우, 직접적인 불량률 감소 효과와는 별개로 브랜드 보호를 위해 비전 검사 시스템 도입이 정당화되는 경우가 많습니다.
Q: rPET 콘텐츠를 실행하면 폐기율이 영구적으로 증가하나요?
일반적으로 rPET는 순수 PET 대비 10% 혼합 비율에서 스크랩률을 0.2~0.4%포인트, 30% 혼합 비율에서 0.5~1.0%포인트 증가시킵니다. 이러한 증가는 매개변수 최적화(건조 온도, 배럴 온도, 사이클 시간)를 통해 부분적으로 상쇄할 수 있습니다. 최적화된 매개변수가 확립되면 30% 혼합 비율에서도 rPET 스크랩 프리미엄은 0.2~0.3%포인트로 감소합니다. 자세한 rPET 가공 프로토콜은 다음을 참조하십시오. ISBM에서의 rPET 처리.
질문: 불량률 감소와 생산 주기 개선 중 어느 쪽에 먼저 집중해야 할까요?
불량률 감소를 우선으로 하고, 그 다음으로 사이클 시간을 단축해야 합니다. 불량률이 높은 상태에서 사이클 시간을 줄이면 사이클이 짧아져 매개변수 변동 여유가 줄어들기 때문에 불량률이 오히려 증가하는 경우가 많습니다. 불량률이 1.0% 미만으로 떨어지면 품질 저하 없이 사이클 시간 최적화가 가능해집니다. 한국의 제조업체들은 이 순서를 반대로 하면 일반적으로 품질 저하로 2~3주를 허비한 후에야 정상 수준으로 복귀할 수 있습니다.
질문: 지속적인 관리가 없을 경우, 폐기물 감소 효과는 일반적으로 얼마나 오래 지속되나요?
SPC 모니터링과 작업자 교육이 없다면, 매개변수 변동과 작업자 습관의 퇴보로 인해 6개월 이내에 불량률 감소 효과가 40~60%만큼 감소합니다. 5단계 프레임워크의 모니터링 및 유지 단계는 바로 이러한 감소를 방지하기 위해 마련되었습니다. SPC 체계가 잘 갖춰진 한국 제조업체들은 불량률 감소 효과를 무기한으로 유지하고 있습니다. 반면 4~5단계를 건너뛴 업체들은 일반적으로 9~12개월마다 불량률 감소 사이클을 반복하게 되는데, 이는 비용과 효율성 측면에서 비효율적입니다.
11. 결론
불량률 감소는 한국 ISBM(단일 병/병) 제조업체에게 가장 효과적인 운영 개선 방안입니다. 대부분의 공장은 1.5~2.51톤의 불량률을 보이고 있으며, 5단계 프레임워크를 체계적으로 적용하면 0.8~1.21톤으로 줄일 수 있는 명확한 길이 있습니다. 일반적인 1천만~2천만 병 생산 라인의 경우, 한국 경쟁력 있는 불량률 수준으로 전환할 때 연간 3억~8억 원의 비용 절감 효과를 볼 수 있으며, 이는 일반적으로 다른 어떤 단일 운영 개선 기회보다 높은 수치입니다.
이 프레임워크는 불량률 감소를 예술적 감각에서 체계적인 원칙으로 전환하기 때문에 성공적입니다. 측정 단계에서는 정확한 기준선을 설정합니다. 분석 단계에서는 결함을 특정 근본 원인 범주에 매핑합니다. 수정 단계에서는 목표에 맞는 매개변수를 수정합니다. 모니터링 단계에서는 SPC를 통해 편차를 방지합니다. 유지 단계에서는 교육 및 문서화를 통해 개선 사항을 공고히 합니다. 각 단계는 이전 단계를 기반으로 구축되므로, 단계를 건너뛰면 회귀 오류가 발생합니다.
불량률 감소 구현에 대한 외부 지원을 필요로 하는 한국 제조업체를 위해 Ever-Power 한국 엔지니어링 팀은 원격 컨설팅(매개변수 감사, 결함 분석)과 현장 엔지니어링(3단계 개선 구현, 4단계 SPC 구축)을 모두 제공합니다. 일반적인 지원은 90일 로드맵을 기반으로 하며, 한국 고객의 경우 24~48시간 이내에 현장 파견이 이루어집니다.
90일 안에 불량률을 40~60%까지 줄일 준비가 되셨습니까?
현재 불량률, 주요 불량 유형 3가지, 플랫폼 모델 및 생산량을 공유해 주세요. 저희 한국 엔지니어링 팀에서 72시간 이내에 근본 원인 분석, 우선 개선 계획 및 90일 불량률 감소 로드맵이 포함된 불량률 감사 보고서를 제공해 드립니다.
더 많은 자료 보기
편집자: Cxm


