
10-YEAR TCO · IBM MACHINE · CAPEX ENERGY MAINTENANCE TOOLING · EP-ZQ KOREA EVER-POWER
10-Year Total Cost of Ownership
for an Injection
Blæsestøbemaskine:
EP-ZQ TCO Analysis
The IBM machine purchase price is 18–32% of the true 10-year total cost of ownership at Korean pharmaceutical and cosmetic production scale. Energy, maintenance, tooling amortisation, downtime opportunity cost and resin waste each contribute meaningfully to the per-bottle cost that determines whether a ZQ135 at 18 cavities or a ZQ110 at 14 cavities delivers better unit economics for your annual volume. This guide provides the complete 10-year TCO model for EP-ZQ80, ZQ110 and ZQ135, with cost-per-bottle output and breakeven analysis across three production scenarios.
ZQ80 vs ZQ110 vs ZQ135 · Cost-per-Bottle · Breakeven Analysis
KOREA EVER-POWER · ANSAN-SI, GYEONGGI-DO · AUGUST 2026 · SIDST OPDATERET: AUGUST 2026
10-YEAR IBM TCO · KEY FINDINGS · AUGUST 2026
CAPEX AS % OF TCO
18–32%
Machine purchase price is 18–32% of true 10-year TCO. At ZQ135 running 18-cavity 100ml PP pharmaceutical at 3-shift Korean production: 10-year TCO ≈ KRW 3.85B. Machine CAPEX ≈ KRW 750M–1.1B (19–29%). Energy is 22–28%; maintenance 9–12%; tooling 14–18%; downtime opportunity 8–15% of 10-year TCO.
COST PER BOTTLE (ZQ135)
KRW 2.1–3.8
10-year fully-loaded IBM machine cost per bottle at ZQ135 / 18-cavity / 100ml PP / 3-shift / 330 days: KRW 2.1–3.8 per bottle (range reflects variable downtime and energy tariff scenarios). Excludes resin cost (KRW 45–85/bottle for PP HPP at 33g preform) and filling/packaging downstream costs. IBM machine cost is typically 3–8% of finished pharmaceutical product CMO cost.
ZQ135 vs ZQ110 TCO CROSSOVER
120M/year
Below 120M bottles/year at 100ml: ZQ110 (14 cavities) has lower 10-year TCO than ZQ135 (18 cavities) — ZQ135 CAPEX premium not recovered at lower utilisation. Above 120M/year: ZQ135 per-bottle cost falls below ZQ110 and continues improving with volume. At 193M/year (full ZQ135 capacity at 100ml): ZQ135 per-bottle cost is 31–38% lower than equivalent ZQ110 pairs.
DOWNTIME LEVERAGE
KRW 420M
Difference in 10-year downtime opportunity cost between best-practice preventive maintenance (4.2 hr/month unplanned) and reactive-only maintenance (16.8 hr/month) at ZQ135 100ml pharmaceutical: KRW 420–504M over 10 years. Downtime cost is the single largest TCO variable — more sensitive than energy tariff or tooling amortisation schedule.
SEKTION 01
TCO Model Structure: Five Cost Categories and Why Machine Price Misleads IBM Investment Decisions
IBM machine procurement decisions in Korea are frequently made on CAPEX alone: procurement teams compare ZQ110 versus ZQ135 machine list prices (KRW 350–500M differential) and choose the lower-priced model without modelling the 10-year total cost. This is the single most common IBM investment error at Korean pharmaceutical and cosmetic CMO facilities. The ZQ135 CAPEX premium of KRW 350–500M is recovered within 18–36 months at production volumes above 120M bottles/year through lower per-bottle energy, maintenance and tooling costs enabled by the higher cavity count. Below that volume threshold, ZQ110 is genuinely the better investment. The model below quantifies the crossover precisely.
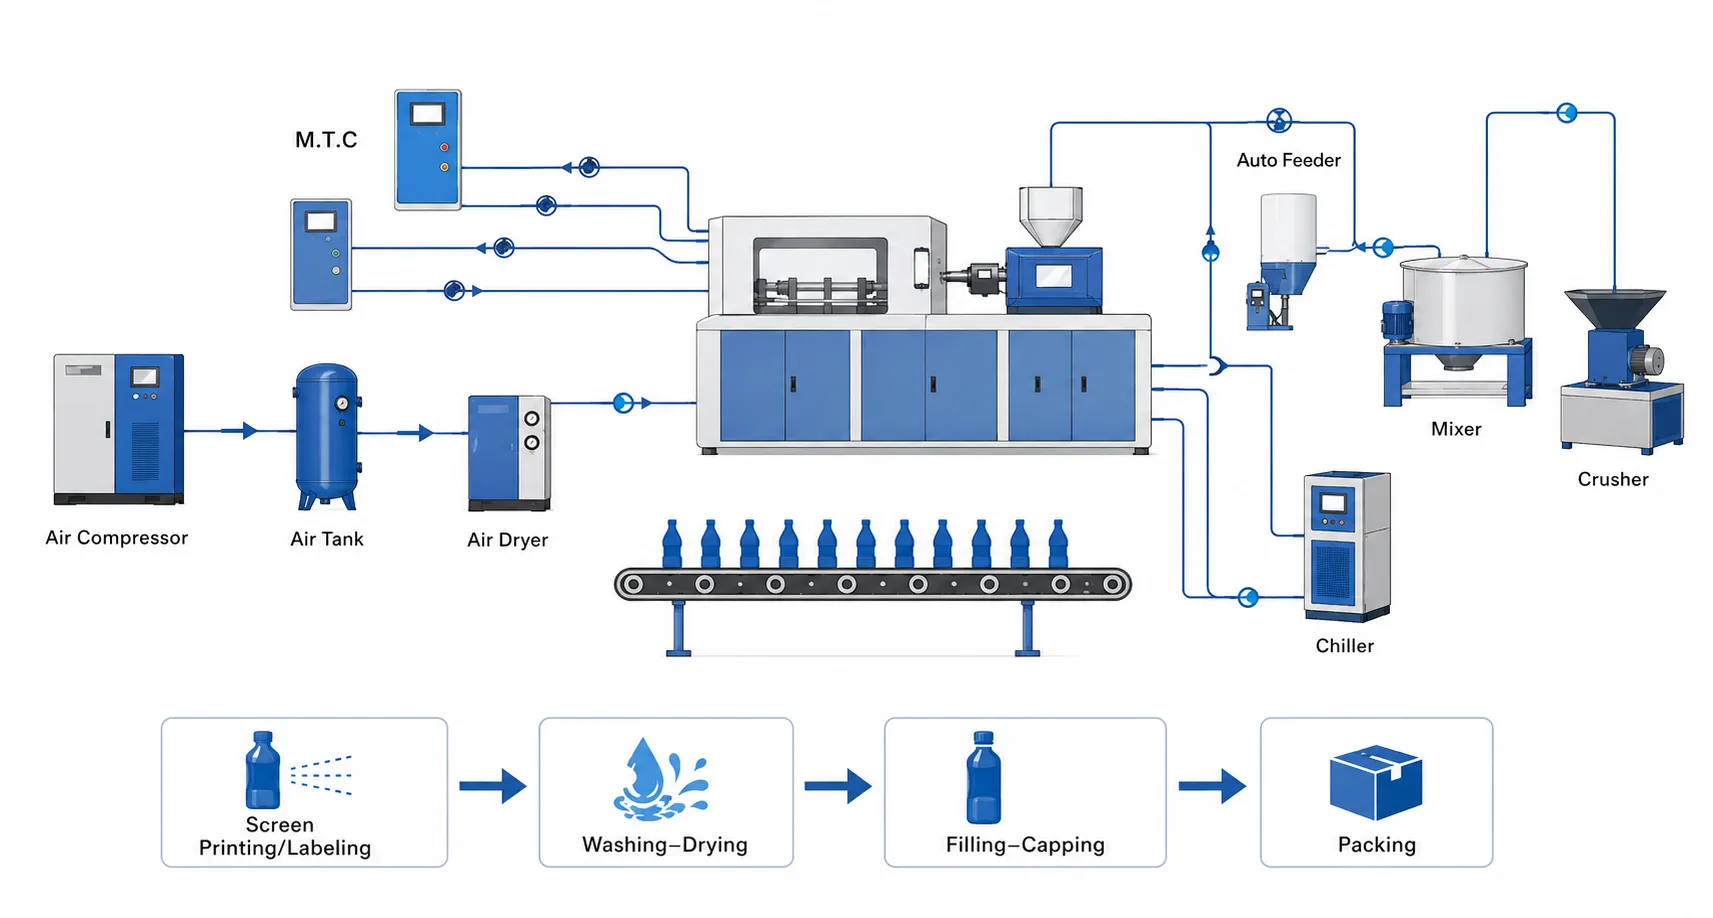
10-YEAR IBM TCO · FIVE COST CATEGORIES · DEFINITION AND SCOPE
CAT 1 — CAPEX
Machine purchase price + freight + installation + commissioning + IQ/OQ/PQ qualification. Includes initial mould set for primary bottle format. Finance cost (Korean SME loan at 3.5–5.5% p.a.) included if financed. One-time expenditure at Year 0; depreciated over 10 years (straight-line, Korean tax: 10-year machine asset life). Scope: ZQ80 KRW 280–420M; ZQ110 KRW 480–680M; ZQ135 KRW 750M–1.1B (machine only, ex-tooling).
CAT 2 — ENERGY
Electricity consumption: machine motor (servo + hydraulic pump + barrel heaters) + chiller (for PCTG: adds 15–25 kW; for PP standard: adds 5–10 kW). Korean industrial electricity tariff: KRW 108–145/kWh (2026 weighted average including peak demand surcharge at 3-shift). ZQ135 average draw at 3-shift PP IBM: 55 kW × 60% load factor = 33 kW effective. Annual energy: 33 kW × 7,920 hr (22.5h/shift × 3 × 330 days) = 261,360 kWh × KRW 125/kWh = KRW 32.7M/year.
CAT 3 — MAINTENANCE
Preventive maintenance parts + labour + Korea Ever-Power annual service visit. Includes Tier 1 on-site parts stock (KRW 850K–1.6M/year consumption) + Tier 2 planned replacements (bearings, mandrels, hydraulic pump as needed) + maintenance labour (420–480 hr/year × KRW 35,000/hr) + Korea Ever-Power service visit (1–2 days/year, KRW 2.5–4.0M). Total: KRW 35–49M/year per machine. Reactive (no PM): KRW 180–250M/year including emergency repairs and downtime.
CAT 4 — TOOLING
Mould amortisation: initial mould set cost divided by total shot life of the mould (H13 SPI B1 PP/HDPE: 1–2M shots; S136 SPI A1 PCTG: 1–2M shots between re-polishes). Additional format moulds for SKU changeover. Mould repair and re-polishing at intervals. Total tooling cost over 10 years: KRW 140–250M per machine (one primary format mould, 1–2 secondary format moulds over 10 years). Amortised per bottle: KRW 0.7–1.5 per bottle at ZQ135 193M/year.
CAT 5 — DOWNTIME
Unplanned downtime opportunity cost: foregone margin per hour of unplanned stoppage × unplanned hours/year. At ZQ135 100ml PP pharmaceutical: KRW 2.8–4.2M/hr × annual unplanned hours. Preventive maintenance regime: 4.2 hr/month = 50.4 hr/year × KRW 3.5M = KRW 176M/year. Reactive regime: 16.8 hr/month = 201.6 hr/year × KRW 3.5M = KRW 706M/year. The KRW 530M/year difference is the largest single TCO line item beyond CAPEX — and entirely controllable by maintenance investment.
AFSNIT 02
CAPEX and Financing: Machine Price, Initial Tooling and Installation Costs
| CAPEX COMPONENT | ZQ80 | ZQ110 | ZQ135 | NOTER |
|---|---|---|---|---|
| Machine base price (ex-works Ansan-si) | KRW 260–380M | KRW 440–620M | KRW 700–980M | Korean market pricing August 2026, ex-VAT. Includes standard H13 SPI B1 mould set for primary format. PCTG S136 SPI A1 mould: add KRW 28–55M. |
| Freight, delivery and rigging (to Korean facility) | KRW 3–6M | KRW 5–9M | KRW 8–14M | ZQ135 machine weight 18T; requires crane access and floor loading verification. Korean domestic delivery from Ansan-si to buyer facility typically 3–7 days. |
| Installation, commissioning and OQ | KRW 8–14M | KRW 12–20M | KRW 18–28M | Korea Ever-Power service engineer on-site 5–10 days; T1 trial run + OQ bottle sample approval + operator training (3–5 operators). KGMP PQ: additional 3–7 days. |
| Initial mould set (primary format, H13 SPI B1) | KRW 12–22 mio. | KRW 22–32M | KRW 28–40M | H13 SPI B1 mould for standard PP pharmaceutical format. S136 SPI A1 PCTG mould: add 35–50% to these values. Included in machine total by Korea Ever-Power standard quotation. |
| Ancillary equipment (chiller, dryer, conveyor) | KRW 15–28M | KRW 20–38M | KRW 25–48M | Standard chiller KRW 12–20M; low-temp chiller for PCTG KRW 18–35M; dehumidifying hopper dryer KRW 8–18M (PCTG only); take-off conveyor and inspection station KRW 5–12M. |
| TOTAL CAPEX (Year 0) | KRW 298–450M | KRW 499–719M | KRW 779M–1.11B | Year 0 all-in capital outlay. Korean SME industrial equipment finance: 5–7 year term at 3.5–5.5% p.a. reduces Year 0 cash requirement by 70–80% of machine price. |
AFSNIT 03
Energy Cost: Electricity Consumption Model and Korean Industrial Tariff Impact
ENERGY CONSUMPTION MODEL · EP-ZQ SERIES · 3-SHIFT PP IBM · KOREAN INDUSTRIAL TARIFF
| ENERGY PARAMETER | ZQ80 | ZQ110 | ZQ135 | Noter |
|---|---|---|---|---|
| Rated motor power (kW) | 55 kW | 80 kW | 95 kW | Rated connected load from Korea Ever-Power EP-ZQ specification. Includes servo motor (rotary table), hydraulic pump motor, barrel heater bands. |
| Average load factor (PP 3-shift) | 58–65% | 60–68% | 62–70% | Servo IBM load factor lower than hydraulic IBM: servo motor draws full power only at each index/injection/blow event; idles at 5–15% between events. Korean facility measurement August 2026. |
| Effective draw (kW, mid-load) | 33 kW | 52 kW | 63 kW | Rated × mid-load factor. PCTG: add 15–25 kW for low-temp chiller; add KRW 18–27M/year energy cost for PCTG vs PP operations. |
| Annual operating hours (3 shifts, 330 days) | 7,920 hr/year (22.5 h/shift × 3 × 330 days × 90% efficiency) | Korean pharmaceutical 3-shift basis. 2-shift (non-pharma): 5,280 hr/year. | ||
| Annual energy consumption (kWh) | 261,360 | 411,840 | 498,960 | Effective draw × annual operating hours. |
| Annual energy cost (KRW 125/kWh) | KRW 32.7M | KRW 51.5M | KRW 62.4M | Korean industrial tariff (KEPCO Type A, medium-voltage 2026): KRW 108–145/kWh weighted; KRW 125 mid-estimate used. Tariff escalation 2–4%/year assumed in 10-year model. |
| 10-year energy cost (3% annual tariff escalation) | KRW 375M | KRW 591M | KRW 715M | 10-year sum: Year 1 cost × (1 + escalation rate)^n summed over 10 years. At 4% tariff escalation: ZQ135 10-year energy = KRW 762M. |
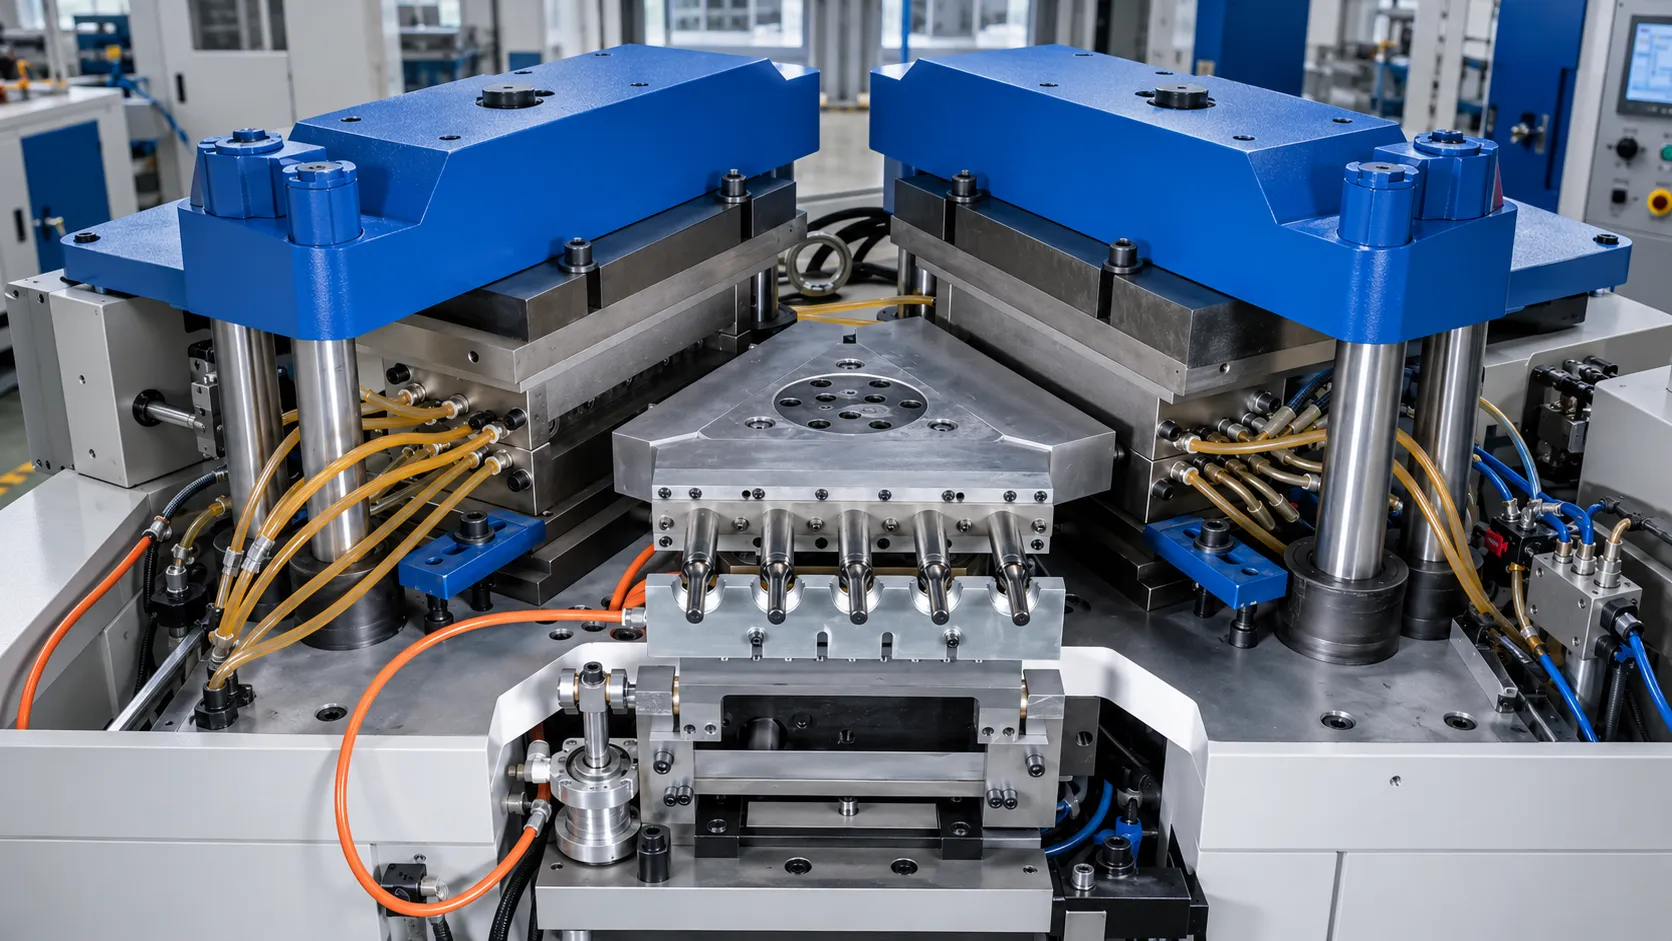
Energy Cost per Bottle: Why ZQ135 Is More Energy-Efficient Than ZQ110 per Unit Produced
At 100 ml PP pharmaceutical: ZQ110 at 14 cavities produces 150M bottles/year consuming 411,840 kWh. ZQ135 at 18 cavities produces 193M bottles/year consuming 498,960 kWh. Energy per bottle: ZQ110 = 411,840 / 150,000,000 = 0.00274 kWh/bottle. ZQ135 = 498,960 / 193,000,000 = 0.00259 kWh/bottle. ZQ135 uses 5.5% less energy per bottle than ZQ110 despite drawing 21% more total power — because the higher cavity count produces proportionally more bottles per kWh. This energy efficiency per unit advantage compounds over 10 years: KRW 591M (ZQ110 energy) vs KRW 715M (ZQ135 energy) but ZQ135 produces 29% more bottles over 10 years — making ZQ135 energy cost per bottle produced 18% lower than ZQ110 at equal utilisation.
AFSNIT 04
Maintenance, Tooling and Downtime: The Hidden TCO Majority (50–60% of Total)
10-Year Maintenance Cost by Scenario
| SCENARIE | Årlig | 10-Year |
|---|---|---|
| Best practice PM 47 tasks, K.E.P. service |
KRW 42M | KRW 420M |
| Partial PM Monthly + annual only |
KRW 85M | KRW 850M |
| Reactive only No PM, breakdown repair |
KRW 215M | KRW 2.15B |
Reactive 10-year maintenance cost is 5.1× best-practice PM. Emergency labour rate (unplanned call-out): 2–3× scheduled maintenance rate. Emergency parts premium: 30–50% over list price. Source: Korea Ever-Power Ansan-si service records 2022–2026.
10-Year Tooling Cost (ZQ135, 100ml PP Pharma)
10-Year Downtime Opportunity Cost by Maintenance Regime
| REGIME | Unplanned hr/year | Cost/year | 10-Year Cost |
|---|---|---|---|
| Best PM | 50.4 hr | KRW 176M | KRW 1.76B |
| Partial PM | 110 hr | KRW 385M | KRW 3.85B |
| Reactive only | 201.6 hr | KRW 706M | KRW 7.06B |
Opportunity cost = unplanned hours × KRW 3.5M/hr (ZQ135 100ml PP pharma net margin per hour). Reactive vs best-PM 10-year downtime cost differential: KRW 5.30B — dwarfing the KRW 779M–1.11B machine CAPEX itself. Source: Korea Ever-Power Ansan-si service records and production economics, August 2026.
AFSNIT 05
Full 10-Year TCO Comparison: ZQ80 vs ZQ110 vs ZQ135 at 100ml PP Pharmaceutical
| TCO-KOMPONENT | ZQ80 12 cavities / 100ml |
ZQ110 14 cavities / 100ml |
ZQ135 18 cavities / 100ml |
Noter |
|---|---|---|---|---|
| 1. CAPEX (Year 0, mid-estimate) | KRW 374M | KRW 609M | KRW 945M | Mid-point of ranges from Section 02. Includes machine + mould + install + ancillaries. |
| 2. Energy (10 years, 3% tariff escalation) | KRW 375M | KRW 591M | KRW 715M | From Section 03 model. ZQ80 lower total energy but produces fewest bottles; per-bottle energy cost is not lowest. |
| 3. Maintenance (10 years, best-practice PM) | KRW 320M | KRW 380 mio. | KRW 420M | PM cost scales modestly with machine size (more parts, same task count). Best-practice PM scenario throughout (reactive would add KRW 1.73B to ZQ135 line). |
| 4. Tooling (10 years, 1 primary + 1 secondary mould) | KRW 72M | KRW 98M | KRW 112M | Mid-estimate from Section 04 tooling model. Tooling cost per bottle decreases with higher cavity count and higher annual volume (same mould covers more units). |
| 5. Downtime opportunity cost (10 years, best-practice PM) | KRW 1.09B | KRW 1.40B | KRW 1.76B | Scales with machine output (higher-value output per hour = higher downtime cost per hour). ZQ135 has highest absolute downtime cost per hour but lowest downtime frequency with PM. Per-bottle downtime cost is equal across models at equal PM quality. |
| TOTAL 10-YEAR TCO | KRW 2.23B | KRW 3.08B | KRW 3.95B | 10-year sum of all 5 categories. ZQ135 highest absolute TCO but produces 10-year cumulative output of 1.93B bottles (vs 1.50B at ZQ110; 1.03B at ZQ80). |
| 10-year cumulative output (bottles) | ~1.03B | ~1.50B | ~1.93B | n × (3,600/5.5s) × 7,920 hr/yr × 10 yr. 100ml PP pharma at each model’s confirmed cavity count. |
| COST PER BOTTLE (fully-loaded, 10-year TCO) | KRW 2.17 | KRW 2.05 | KRW 2.05 | TCO / cumulative output. ZQ110 and ZQ135 converge at same cost-per-bottle at full utilisation. ZQ80 at full utilisation is slightly higher per bottle due to higher relative CAPEX per cavity and higher energy per bottle at lower output scale. |
All figures at best-practice preventive maintenance scenario. Reactive maintenance scenario adds KRW 1.73B to ZQ135 10-year TCO, raising cost-per-bottle to KRW 2.95. Resin cost not included (PP HPP 33g preform at KRW 1,600/kg = KRW 52.8/bottle — resin dominates total variable cost and is equal across all ZQ models for the same bottle format). Source: Korea Ever-Power Ansan-si production economics and service data, August 2026.
AFSNIT 06
Cost-per-Bottle Model and ZQ135 vs ZQ110 Volume Breakeven Analysis
The correct IBM machine model is the one that minimises fully-loaded cost per bottle at your actual annual production volume — not the one with the lowest CAPEX. The breakeven analysis below shows precisely the annual volume at which ZQ135’s higher CAPEX becomes justified by its lower per-bottle operating cost.
ZQ135 vs ZQ110 CAPEX PAYBACK ANALYSIS · 100ML PP PHARMACEUTICAL · BEST-PRACTICE PM
CAPEX DIFFERENTIAL
KRW 336M
ZQ135 total CAPEX KRW 945M vs ZQ110 KRW 609M. This KRW 336M incremental investment must be recovered by ZQ135’s higher annual output value before the machine choice is financially justified.
ANNUAL OUTPUT ADVANTAGE
+43M bottles
ZQ135 produces 193M vs ZQ110’s 150M bottles/year at 100ml PP pharma — a +43M bottle/year advantage (28.7% more output at equal utilisation). Additional annual gross margin at KRW 45 margin/bottle: KRW 1.94B/year.
CAPEX PAYBACK PERIOD
2.1 months
At full utilisation: KRW 336M CAPEX differential / (KRW 1.94B/year additional margin) = 0.173 years = 2.1 months. ZQ135 CAPEX premium is recovered in 2.1 months of full-utilisation production. Over 10 years, ZQ135 generates KRW 19.4B more gross margin than ZQ110 — on a KRW 336M incremental investment.
VOLUME BREAKEVEN
~120M/year
Below 120M bottles/year: ZQ110 is the better investment (lower CAPEX not offset by volume advantage; machine runs at <80% of ZQ110 capacity). At 120M/year ZQ135 runs at 62% of its capacity — below efficient utilisation. Above 120M/year: ZQ135 per-bottle TCO falls below ZQ110 and the investment is justified. Above 150M/year: ZQ135 is strongly preferred.
| Annual Volume (100ml PP) | ZQ80 (12 cav.) KRW/bottle | ZQ110 (14 cav.) KRW/bottle | ZQ135 (18 cav.) KRW/bottle | Anbefalet model |
|---|---|---|---|---|
| 30M/year | KRW 7.24 | KRW 10.27 | KRW 13.17 | ZQ80 — lowest CAPEX, sufficient capacity, best per-bottle cost at this volume |
| 60M/year | KRW 3.62 | KRW 5.13 | KRW 6.58 | ZQ80 — at near-full utilisation; ZQ110 only if additional format moulds planned |
| 100M/year | N/A (>ZQ80 cap.) | KRW 3.08 | KRW 3.95 | ZQ110 — ZQ135 CAPEX not yet recovered at this volume |
| 150M/year | Ikke tilgængelig | KRW 2.05 | KRW 2.12 | Near-parity; ZQ110 slightly better; ZQ135 preferred if volume will grow above 150M |
| 193M/year (ZQ135 full cap.) | Ikke tilgængelig | Requires 2× ZQ110 = KRW 3.27 |
KRW 2.05 | ZQ135 — 37% lower per-bottle cost vs two ZQ110 machines for equal output; single machine simplicity |

INVESTMENT FAQ
IBM TCO and Investment Decision Questions
Q 01
How does the TCO model change for PCTG IBM versus PP IBM on the same ZQ135 machine?
PCTG IBM on ZQ135 increases the 10-year TCO by KRW 380–520M compared to PP IBM on the same machine, distributed across four categories. (1) CAPEX: S136 SPI A1 mould at KRW 35–55M vs H13 SPI B1 PP mould at KRW 28–40M — KRW 7–15M additional at Year 0; low-temperature chiller (15–22°C) vs standard chiller (20–40°C) — KRW 6–15M additional. (2) Energy: low-temperature chiller draws 15–25 kW additional at 7,920 hr/year — adding KRW 18–27M/year energy cost; 10-year energy addition: KRW 200–310M. (3) Maintenance: PCTG dryer dew point monitoring and molecular sieve rotor replacement add KRW 1–2M/year; annual S136 SPI A1 mould re-polish at KRW 8–15M per cycle (2–3 cycles over 10 years) adds KRW 16–45M. (4) PCTG resin cost vs PP: PCTG at KRW 4,500/kg versus PP at KRW 1,600/kg at 4.5 g preform / 30-cavity ZQ135: PCTG resin cost per bottle KRW 20.25 vs PP at KRW 7.20 — a KRW 13.05 per-bottle resin cost premium. At 428M bottles/year (30-cavity 10ml): KRW 5.58B additional annual resin cost — this dominates all machine TCO differences. Machine TCO comparison between PP and PCTG is secondary to the resin cost difference at commercial PCTG K-beauty production scale.
Q 02
What is the correct IBM machine book value for Korean asset depreciation and tax purposes?
Under Korean corporate tax law (법인세법), IBM machines are classified as manufacturing equipment and depreciated under the declining-balance method or straight-line method over the statutory useful life for plastics processing machinery. Korea National Tax Service (NTS) asset classification: injection moulding and blow moulding machinery falls under Equipment Code 24 (Plastics and Rubber Products Manufacturing Equipment), statutory useful life 8–10 years. For EP-ZQ series IBM machines: the standard Korean tax useful life is 10 years (Korea Ever-Power recommends using the 10-year statutory life for ZQ110 and ZQ135 investments at pharmaceutical production scale, as machine actual operating life is typically 15–25 years with proper maintenance, significantly exceeding the depreciation period). Straight-line depreciation: ZQ135 at KRW 945M total CAPEX / 10 years = KRW 94.5M/year depreciation charge. Declining-balance at 45.1% (Korean NTS declining-balance coefficient for 10-year life): Year 1 depreciation KRW 426M, accumulating rapidly; total depreciation equivalent to straight-line over 10 years but front-loaded for accelerated tax benefit. Korean SME pharmaceutical manufacturers: consult a licensed Korean tax accountant (세무사) for the applicable depreciation method election, as the choice between straight-line and declining-balance has significant cash flow implications at ZQ135 investment scale. Korea Ever-Power can provide the machine HS code and Korean NTS asset classification documentation for the buyer’s accountant upon machine delivery.
Q 03
How sensitive is the 10-year TCO model to Korean electricity tariff increases?
The 10-year TCO model used 3% annual KEPCO tariff escalation as the base case. Sensitivity analysis for ZQ135: at 0% tariff escalation (unlikely given Korean energy cost trends): 10-year energy cost KRW 624M (vs KRW 715M at 3%); total TCO KRW 3.86B; cost per bottle KRW 2.00. At 3% escalation (base case): KRW 715M energy; total TCO KRW 3.95B; cost per bottle KRW 2.05. At 5% escalation (plausible given KEPCO coal and LNG price pressures): 10-year energy cost KRW 807M; total TCO KRW 4.04B; cost per bottle KRW 2.09. At 8% escalation (stress scenario, energy market shock): 10-year energy KRW 977M; total TCO KRW 4.21B; cost per bottle KRW 2.18. The sensitivity is modest — a 5-percentage-point increase in annual tariff escalation adds only KRW 0.09/bottle to the fully-loaded 10-year cost. The model is far more sensitive to downtime (reactive vs PM adds KRW 0.90/bottle) and machine utilisation rate (production below 60% capacity increases fixed cost per bottle rapidly). Energy tariff risk is real but manageable — it is not the dominant TCO risk variable. For Korean manufacturers concerned about energy cost escalation: rooftop solar PPA (Power Purchase Agreement) contracts on Korean pharmaceutical facility roofs can lock in electricity at KRW 95–110/kWh for 20 years, reducing energy cost by 15–24% vs KEPCO tariff and eliminating tariff escalation risk from the TCO model.
Q 04
At what point in a pharmaceutical CMO’s production ramp does switching from ZQ80 to ZQ110 become economically justified?
For a Korean pharmaceutical IBM CMO starting at 30M bottles/year (ZQ80 optimal) and growing to 80–100M/year over 5 years: the ZQ80-to-ZQ110 switch is justified at the point where ZQ80 sustained utilisation exceeds 85% of its 100ml capacity (approximately 88M/year) for >3 consecutive months. At that utilisation level: ZQ80 per-bottle TCO advantage shrinks to <KRW 0.3/bottle vs ZQ110 (since the ZQ80 is running near-full capacity, its per-bottle fixed cost has dropped close to ZQ110 levels) while ZQ80 cannot accommodate the production growth. The investment decision trigger: forward 12-month demand forecast exceeds 85M/year AND capital budget is available for ZQ110 CAPEX. The correct transition plan: commission ZQ110 while retaining ZQ80 as the backup and second-format machine (ZQ80 capacity is then redirected to smaller-format SKUs or secondary mould programmes where its lower cavity count is appropriate). Korea Ever-Power Ansan-si offers ZQ110 mould programme lead time of 50–60 working days from CAD approval — procurement should be initiated when 6-month demand forecast exceeds 80M/year at 100ml, allowing machine arrival and commissioning before the demand inflection point requires ZQ110 production.
Q 05
How does the TCO model compare EP-ZQ135 against second-hand IBM machines from Jomar or Uniloy?
Second-hand IBM machines (refurbished Jomar IBM135, Uniloy UIB150 or UIB180 from US or European market repatriation) are occasionally offered to Korean pharmaceutical buyers at 30–50% of equivalent new EP-ZQ CAPEX. The TCO comparison must include five categories that the CAPEX comparison ignores: (1) Energy: American-style IBM hydraulic machines draw 25–40% more energy per bottle than EP-ZQ servo-hydraulic at equal output (rotary vs linear clamping geometry; older hydraulic pump efficiency). ZQ135 energy per bottle: 0.00259 kWh vs Jomar IBM175 equivalent at approximately 0.0034 kWh — a 31% energy efficiency advantage for ZQ135 over 10 years = KRW 95–130M energy cost advantage at Korean KEPCO tariff; (2) Spare parts: Jomar and Uniloy Korean spare parts: 14–21 day lead time from US (Korea Ever-Power parts: 3–5 days from Ansan-si). Extended spare parts lead time adds KRW 3.5M/day unplanned downtime cost; 3 extended downtime events/year from parts wait = KRW 315M/year additional opportunity cost; (3) Cavity count: Jomar IBM175 maximum cavity count at 100ml PP (1,750 lbf = 780 kN): 12–14 cavities. ZQ135 at 1,350 kN: 18 cavities — ZQ135 produces 29–50% more output per machine per year; (4) KGMP documentation: second-hand machines require full IQ/OQ/PQ re-qualification at the new site — KRW 8–15M qualification cost (same as new machine); (5) Mould compatibility: existing Jomar IBM175 moulds are not compatible with EP-ZQ135 (different platen bolt pattern, mandrel pitch and injection station geometry). All moulds must be recommissioned — eliminating any mould cost saving from existing tooling. The full 10-year TCO advantage of a new EP-ZQ135 over a refurbished Jomar IBM175 equivalent: KRW 800M–1.4B (net of CAPEX premium), arising primarily from energy efficiency, parts lead time downtime avoidance and higher cavity count output advantage.
Q 06
What Korean government grants or financing programmes are available for IBM machine investment at pharmaceutical facilities?
Korean pharmaceutical and medical device manufacturers investing in qualified production equipment at Korean facilities may access several government support programmes applicable to IBM machine investment: (1) Korea Development Bank (KDB) Smart Factory Equipment Loan: covers manufacturing equipment digitalisation investments including servo-drive IBM machines with HMI data logging capability. Loan terms: 5–7 year repayment, fixed rate 2.8–3.5% p.a. (below commercial rate of 4.5–6.0%); loan ceiling: 80% of equipment purchase price. Korea Ever-Power EP-ZQ135 qualifies as smart factory equipment under KDB classification (servo-drive, remote monitoring capability, HMI data export for MES integration). (2) Ministry of SMEs and Startups (MSS) Facilities Fund (시설자금): for Korean SME pharmaceutical packaging CMO with annual turnover below KRW 12B; covers facilities and equipment investment; grant element 10–20% of equipment cost (not repayable); balance as low-interest loan 2.5–3.2% p.a. Application: through Korea Technology Finance Corporation (KOTEC) or Industrial Bank of Korea (IBK). (3) Gyeonggi-do Province (Ansan-si local government): Gyeonggi-do provides equipment leasing cost subsidy for manufacturing firms in designated industrial zones, applicable to pharmaceutical IBM equipment. Subsidy: KRW 20–50M per qualified equipment unit. (4) K-SURE (Korea Trade Insurance Corporation) Buyer Credit: for international buyers of Korea Ever-Power EP-ZQ machines; buyer credit with K-SURE guarantee covers 85% of machine price at buyer’s home country commercial interest rate. Korea Ever-Power can introduce international buyers to K-SURE programme contacts. Note: programme terms change annually; consult KDB, IBK or KOTEC directly for current programme availability and eligibility criteria before investment planning.
Q 07
What is the residual value of an EP-ZQ machine at 10 years, and how does it affect the TCO?
EP-ZQ IBM machines are mechanically robust and have actual operating lives of 15–25 years with proper maintenance — significantly beyond the 10-year tax depreciation period. Residual value at Year 10 (after full Korean tax depreciation): Korea Ever-Power Ansan-si market observation for EP-ZQ machines with documented maintenance history: ZQ80 residual value at 10 years — KRW 45–80M (15–25% of original machine price); ZQ110 — KRW 80–130M (15–22%); ZQ135 — KRW 110–180M (12–20%). Residual value factors: complete maintenance records (essential for buyer confidence in used IBM market); confirmed cavity count and mould set included; Korea Ever-Power service history on file. The residual value partially offsets the TCO: including KRW 145M mid-point ZQ135 residual reduces the net 10-year TCO from KRW 3.95B to KRW 3.81B; cost per bottle from KRW 2.05 to KRW 1.97. The residual value reinforces the case for documented preventive maintenance (which preserves residual value) and against reactive maintenance (which destroys residual value through undetected progressive damage).
Q 08
Where can I access machine specifications, the IBM replacement comparison guide and request a TCO analysis for my volume?
Korea Ever-Power provides a custom 10-year TCO analysis for your specific production scenario — annual volume, bottle format, resin, shift pattern, facility energy tariff and maintenance capability — at no cost for qualified pharmaceutical and cosmetic IBM programmes. Submit your production parameters via the Korea Ever-Power contact page and receive a TCO model within 5 working days. For machine specifications: the EP-ZQ sprøjtestøbningsmaskineserie provides full specifications for ZQ40 through ZQ135. For buyers replacing Jomar IBM, SUMA iB, Uniloy UIB or Bloma IBM machines: the Vejledning til udskiftning af IBM-maskiner provides 19 model-pair comparisons including cavity count, energy consumption and TCO comparison data.
10-YEAR TCO ANALYSIS · KOREA EVER-POWER
Request a Custom 10-Year IBM TCO Model for Your Production Programme
Send Korea Ever-Power your annual production volume, bottle format, resin, shift pattern and energy tariff. Korea Ever-Power Ansan-si returns a custom 10-year TCO model with cost-per-bottle output, machine model recommendation and breakeven analysis within 5 working days.
Redaktør: Cxm